University of California Tableau User Group (TUG) Hosted By: UC


9 Slides838.07 KB
University of California Tableau User Group (TUG) Hosted By: UC Office of the President 11-18-16 06/29/2024
Agenda Welcome/introductions A Couple of useful design practices – Gregory - Making dashboards that are irresistible – Tip #2 – Gregory – ITS Metric Dashboards Great dashboard of the month – Tim Wheeler and Irvin Palacios - Cash Balance Summary Dashboard A few useful Tableau Features – Kari Peterson – Using Parameters Next meeting Q&A 11/18/2016
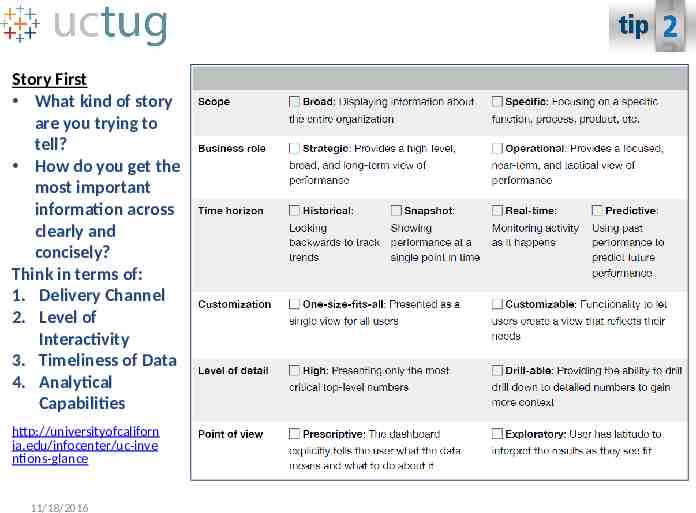
Story First What kind of story are you trying to tell? How do you get the most important information across clearly and concisely? Think in terms of: 1. Delivery Channel 2. Level of Interactivity 3. Timeliness of Data 4. Analytical Capabilities http://universityofcaliforn ia.edu/infocenter/uc-inve ntions-glance 11/18/2016
Additional Resource TED Talk, “Making data mean more through storytelling”, by Ben Wellington https://www.youtube.com/watch?v 6xsvGYIxJok 11/18/2016
ITS Metrics Dashboards http:// qa.ucop.edu/information-technology-services/services/it-metrics/index.ht ml 11/18/2016
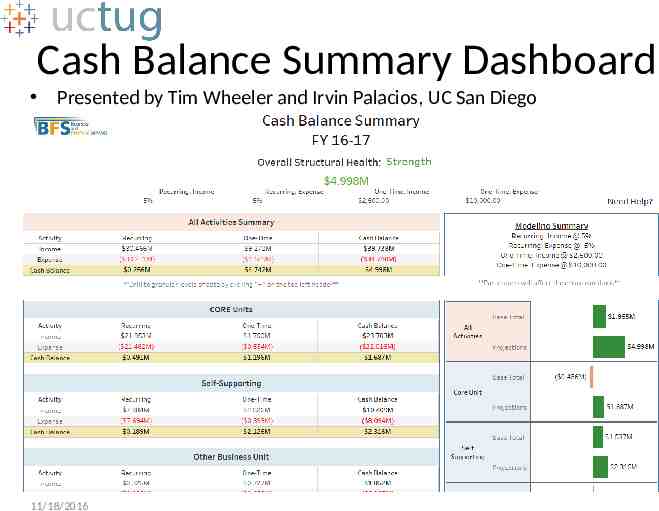
Cash Balance Summary Dashboard Presented by Tim Wheeler and Irvin Palacios, UC San Diego 11/18/2016
Using Parameters Presented by Kari Peterson (UC Berkeley) 11/18/2016
Next Meeting Any volunteers? – What interested you at the Tableau 2016 conference? – Share a useful tip you learned – Provide a detailed how-to
Slack uctech.slack.com