UNDERSTANDING DATA CENTER TRAFFIC CHARACTERISTICS 1 Theophilus


19 Slides1.66 MB
UNDERSTANDING DATA CENTER TRAFFIC CHARACTERISTICS 1 Theophilus Benson1, Ashok Anand1, Aditya Akella1, Ming Zhang2 University Of Wisconsin – Madison1, Microsoft Research2
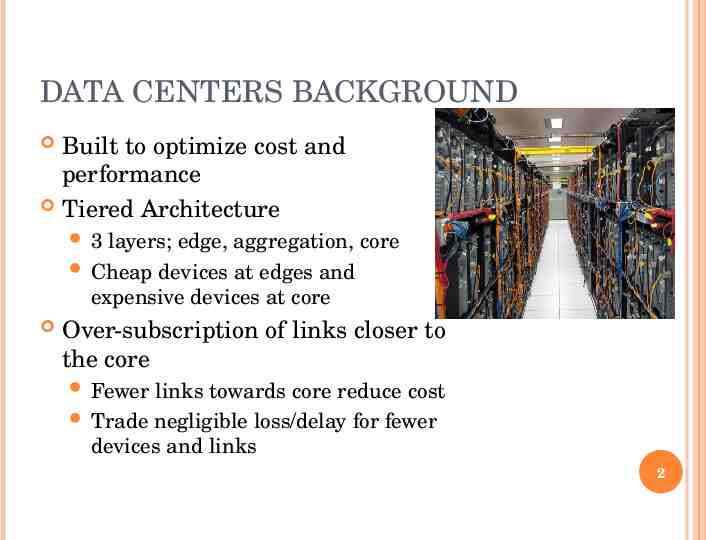
DATA CENTERS BACKGROUND Built to optimize cost and performance Tiered Architecture 3 layers; edge, aggregation, core Cheap devices at edges and expensive devices at core Over-subscription of links closer to the core Fewer links towards core reduce cost Trade negligible loss/delay for fewer devices and links 2
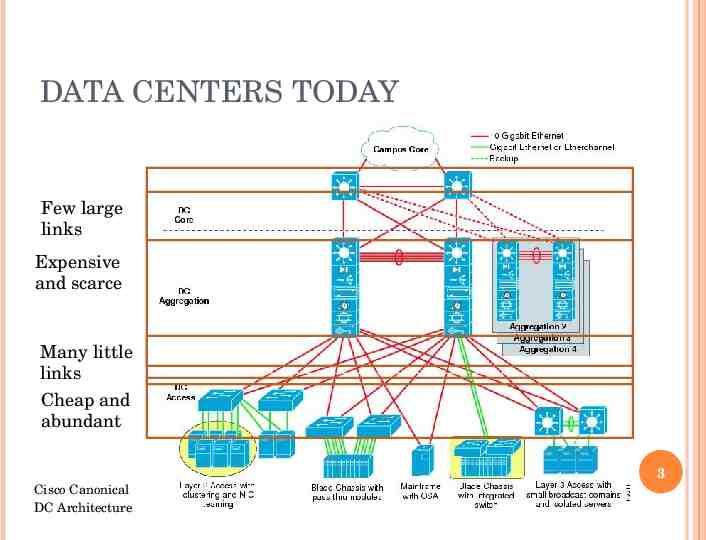
DATA CENTERS TODAY Few large links Expensive and scarce Many little links Cheap and abundant 3 Cisco Canonical DC Architecture
CHALLENGES IN DESIGNING FOR DATA CENTERS Very little is known about data centers No models for evaluation Lack of knowledge effects evaluation Use properties of wide area network traffic. Make up traffic matrixes/random traffic patterns. Insufficient for the following reasons Can’t accurately compare techniques Oblivious to actual characteristics of data centers 4
DATA CENTER TRAFFIC CHARACTERIZATION Goals of our project Understand low level characteristics of traffic in data centers What is the arrival process? Is it similar or distinct from wide area networks? How does low level traffic impact the data center? 5
DATA CENTER TRAFFIC CHARACTERIZATION In studying data center traffic we found that: Few links experience loss Many links are unutilized Traffic adheres to ON-OFF Arrival process is log normal 6
OUTLINE Background Goals Data set Observations and insights Overview of traffic generator (see paper for details) Conclusion 7
DATA SETS Type Data from 19 data centers Differences Mean Size (# of Dev) 10 13 9 363 in size and architecture 2-Tier Data for intranet and extranet server farms Applications: messaging, search, video streaming, email # of DC 3-Tier Data consists of Packet traces from edge switches in one data center SNMP MIB of devices in all data centers Data collected over a span of 10 days 8
ANALYZING SNMP DATA Analyze link utilization and drops Analysis from one 5 minute interval Core Aggregation Edge % of links used 59 73 57 % of links with at least one loss 4 3 2 Lot of un-utilized links Back-up/redundant links Aggregation layer has the most used links Funneling of traffic from aggregation Very few links with losses 9
ANALYZING SNMP DATA: LINK UTILIZATION 95th percentile used Core Edge Aggregation Core has fewest links Edge has smaller, (1Gbps) links higher util. than aggregation. 10
ANALYZING SNMP DATA: LINK LOSS RATES Aggregation Edges Core Utilization: Core Edges Aggregation Core has relatively little loss but high utilization All links loose less than 2% of packets Aggregation of flow leads to stability Edge & Aggr have significantly higher losses Few links (20%) experience high losses (over 40%) Most likely due to bursty traffic 11
INSIGHTS FROM SNMP Loss is localized to a few links (4%) Loss may be avoided by utilizing all links 40% of links are unused in some areas Reroute traffic Move applications/migrate virtual machine Inverse correlation between loss and utilization Should examine low level packet traces Traces from same 10 days as SNMP 12
ANALYZING PACKET TRACES Time series of traffic on an edge link ON-OFF traffic at edges Time series shows ON-OFF patterns Binned in 15 and 100 m. secs ON-OFF persists 13
ANALYZING PACKET TRACES What is the arrival process? Matlab curve-fitting (least mean square) Weibull, log normal, pareto, exponential Curve fits log-normal for the 3 distributions Inter-arrival, on-times, off-times All switches exhibit identical patterns Different from pareto (WAN) traffic 14
DATA CENTER TRAFFIC GENERATOR Based on our insights we created a traffic generator Goal: produce a stream of packets that exhibits an ON-OFF arrival pattern Input: distribution of traffic volumes and loss rates from SNMP pulls for a link Output: the parameters for a fine grained arrival process that will produce the input distribution 15
DATA CENTER TRAFFIC GENERATOR Approach Search the space of available parameters Simulate each set of parameters Accept parameters that pass a similarity test with high confidence Wilcoxon used for the similarity test 16
SHARING INSIGHTS Implications for research and operations Evaluate designs with traffic generator Implications for Fat-tree Fat-tree: congestion eliminated through no overprovision and traffic balancing Parameterization: traffic engineering, flow classification, assumes stableness on the order of ‘T’ seconds Our work can inform the setting of ‘T’ 17
CONCLUSION Analyzed traffic from 19 data centers Bottle neck aggregation layer Characterized arrival process at edge links Described a traffic generator for data centers Utilized for evaluation of data center designs Future work Analyze packet trace stableness of traffic matrix ratio of inter/intra-dc communication 18
QUESTIONS? 19