Successes, Solutions, and Similarities: Ways to Maximize Use of Timely


33 Slides4.97 MB
Successes, Solutions, and Similarities: Ways to Maximize Use of Timely Data 12/07/2022
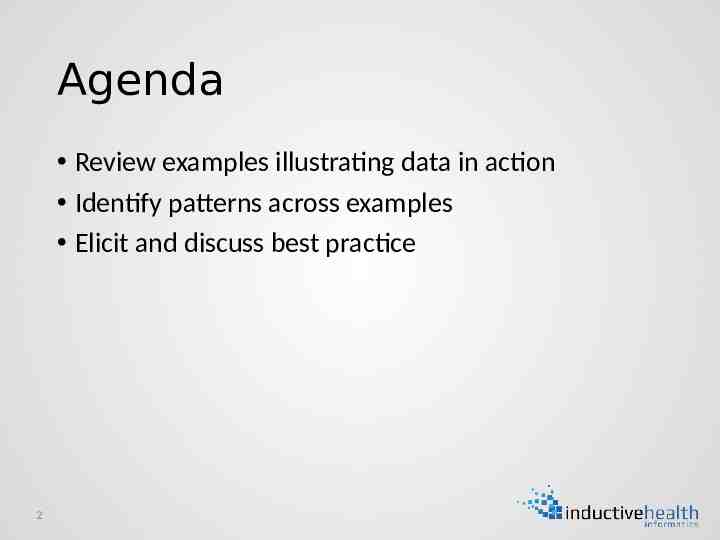
Agenda Review examples illustrating data in action Identify patterns across examples Elicit and discuss best practice 2
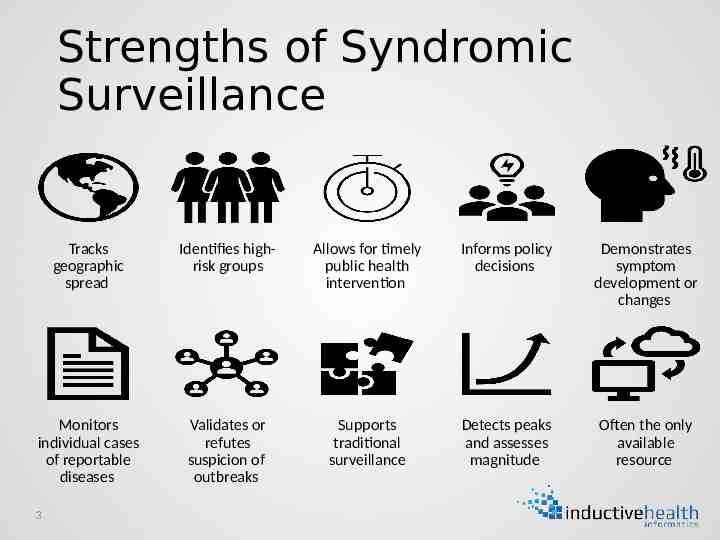
Strengths of Syndromic Surveillance Tracks geographic spread Identifies highrisk groups Allows for timely public health intervention Informs policy decisions Demonstrates symptom development or changes Monitors individual cases of reportable diseases Validates or refutes suspicion of outbreaks Supports traditional surveillance Detects peaks and assesses magnitude Often the only available resource 3
Modern Examples of Timely Syndromic Surveillance Methods in Action Disclaimer: The following examples are publicly available and /or provided by fellow colleagues. We would like to thank them for their work and are proud to highly their efforts in this presentation. 4
Example 1: Rocky Mountain Spotted Fever (RMSF) Brown Dog Tick on reservation Limited Medical Resources Hx of Missing Dx Created an ESSENCE Alert To Catch Potential RMSF Situations & reviewed daily Local epidemiologists identified a patient who met criteria and was transferred Medical records indicated the patient had improved on doxycycline but was scheduled for discharge without completing the recommended treatment RMSF is not locally-acquired in Maricopa County, thus not immediately suspected https://www.cdc.gov/nssp/success-stories/AZ-RMSF.html 5 Local epidemiologist identified this gap and recommended treatment plan be updated accordingly before discharge.
Example 1: Rocky Mountain Spotted Fever Trained the system to alert on known situation that needed action Developed Protocol for when alerted Followed the protocol Took swift action to use timeliness as advantage 6
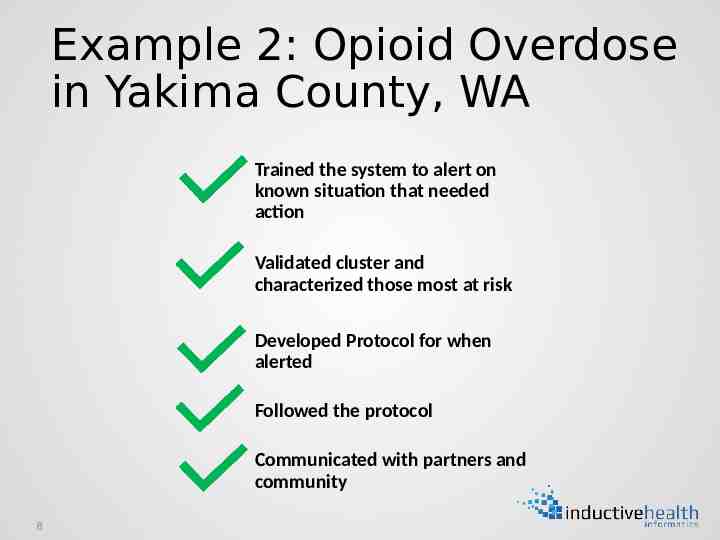
Example 2: Opioid Overdose in Yakima County, WA Increase of emergency department visits related to opioid overdoses both in January 2021 and early February 2021. Hospital staff recorded mentions of Percocet, “Blue Percocet 30”, oxycodone, and fentanyl. The overdoses were observed among patients between 20-50 years and a mix of reported race/ethnicities. The Washington Department of HealthRapid Health Information Network detected potential opioid clusters through data that is routinely collected from Yakima County hospitals. https://www.yakimacounty.us/DocumentCenter/View/27171/02192021 Opioid-Clusters?bidId 7 A press release was distributed to inform the community and requested pharmacies to dispense Narcan to patrons at risk.
Example 2: Opioid Overdose in Yakima County, WA Trained the system to alert on known situation that needed action Validated cluster and characterized those most at risk Developed Protocol for when alerted Followed the protocol Communicated with partners and community 8
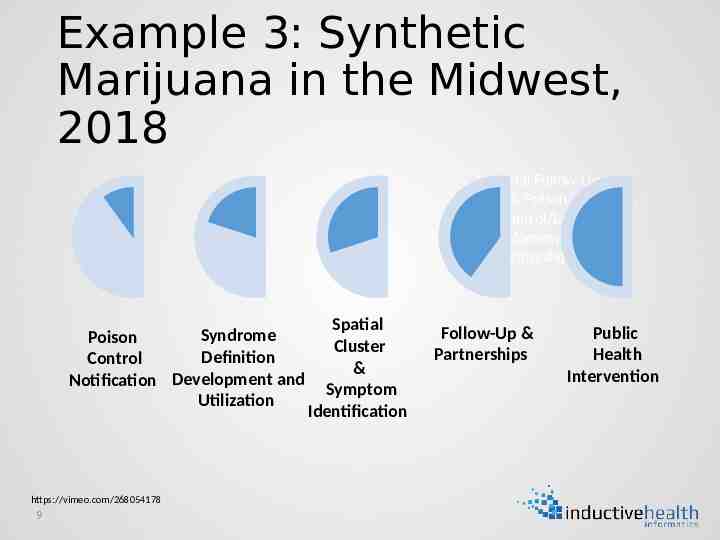
Example 3: Synthetic Marijuana in the Midwest, 2018 Hospital Follow-Up & Poison Control/Law Enforcement Partnerships Syndrome Poison Definition Control Notification Development and Utilization https://vimeo.com/268054178 9 Spatial Cluster & Symptom Identification Follow-Up & Partnerships Public Health Intervention
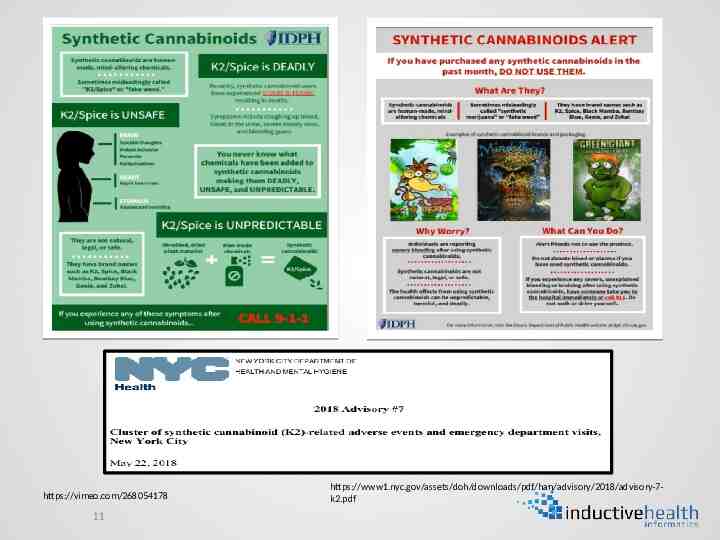
Example 3: Synthetic Marijuana in the Midwest, 2018 Public Health Intervention Syndromic was most valuable early on as hospitals weren’t aware, thus not reporting Allowed HD to review line lists and properly communicate with the hospitals and set up more traditional reporting methods. Eventually had the product tested and found brodifacoum (chemical in rat poison) Treatment is long term and expensive – Vitamin K Put out alerts for the public and had product removed 10 https://vimeo.com/268054178
https://vimeo.com/268054178 11 https://www1.nyc.gov/assets/doh/downloads/pdf/han/advisory/2018/advisory-7k2.pdf
Example 3: Synthetic Marijuana in the Midwest, 2018 Confirmed suspicion of wider problem Alerted hospitals Developed more traditional reporting from sys information ID’d probable cases Characterized who was at risk Put out communications to community and partners Took products off the shelves 12
Epis used an overlay of symptom-based queries (difficulty breathing, loss of taste and smell, etc.) with Flu ICD codes. When flu dx decreased, but symptoms stayed – it was likely COVID Example 4: COVID 13 Beginning of the pandemic - tests not widely available https://vimeo.com/410751579
Example 4: COVID With little to no other data available, Creatively used information that was available to develop deeper understanding 14
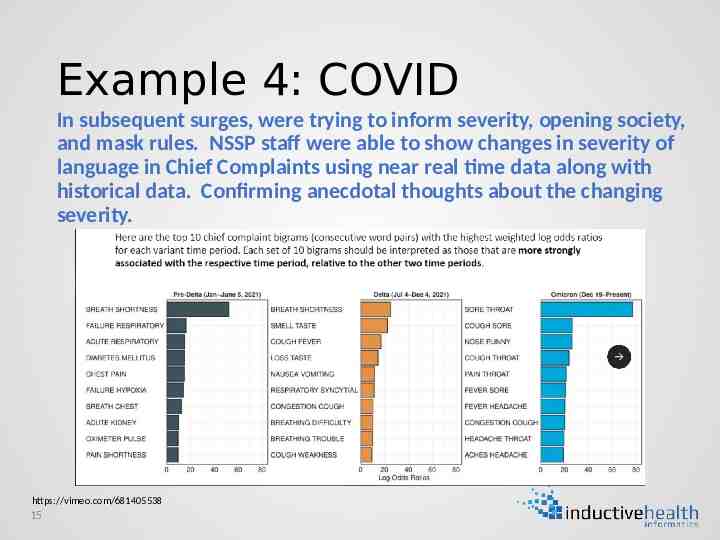
Example 4: COVID In subsequent surges, were trying to inform severity, opening society, and mask rules. NSSP staff were able to show changes in severity of language in Chief Complaints using near real time data along with historical data. Confirming anecdotal thoughts about the changing severity. https://vimeo.com/681405538 15
Example 4: COVID Applied novel analysis techniques Used flexible text to better understand characteristics Informed understanding of severity – implications for policies 16
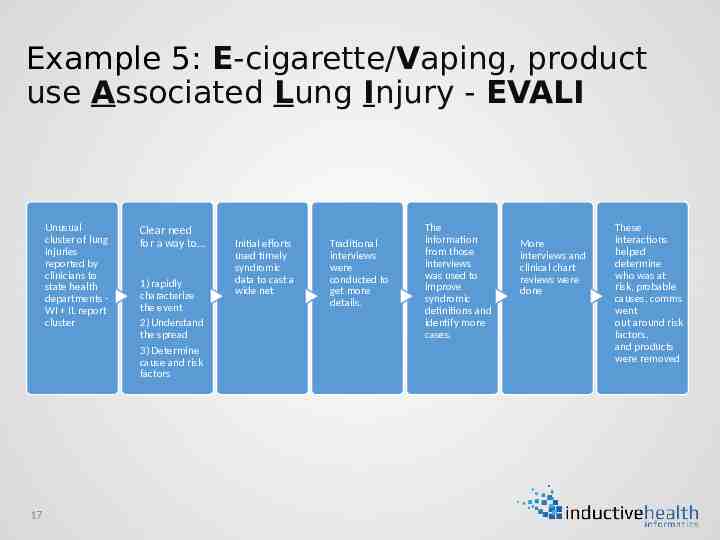
Example 5: E-cigarette/Vaping, product use Associated Lung Injury - EVALI Unusual cluster of lung injuries reported by clinicians to state health departments WI IL report cluster 17 Clear need for a way to 1) rapidly characterize the event 2) Understand the spread 3) Determine cause and risk factors Initial efforts used timely syndromic data to cast a wide net Traditional interviews were conducted to get more details. The information from those interviews was used to improve syndromic definitions and identify more cases. More interviews and clinical chart reviews were done These interactions helped determine who was at risk, probable causes, comms went out around risk factors, and products were removed
Example 5: EVALI https://www.nejm.org/doi/full/10.1056/NEJMsr1915313 18 WI IL report clusters of severe respiratory illnesses among young adults/adolescents, who reported recent use of electronic e-cigarettes/vapes
Example 5: EVALI Used available data to rapidly characterize Used in conjunction with more traditional interview techniques to understand spread and risk factors Continued to refine definitions as interview information became available Communicated with community and partners Took product off the shelves 19
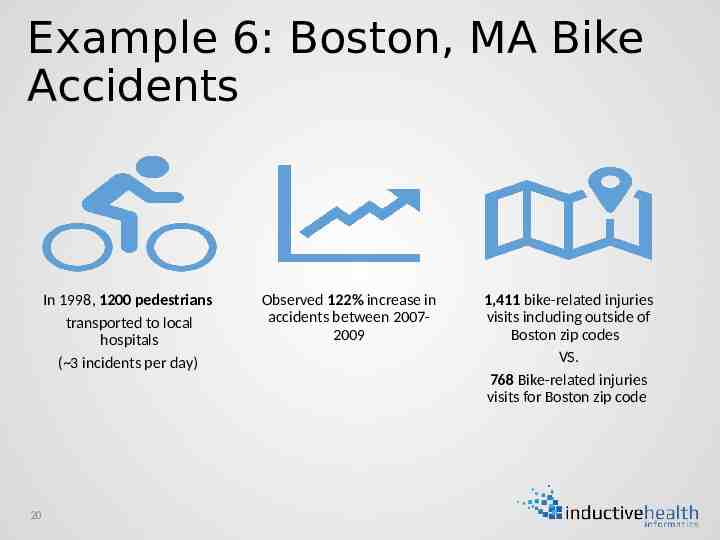
Example 6: Boston, MA Bike Accidents In 1998, 1200 pedestrians transported to local hospitals ( 3 incidents per day) 20 Observed 122% increase in accidents between 20072009 1,411 bike-related injuries visits including outside of Boston zip codes VS. 768 Bike-related injuries visits for Boston zip code
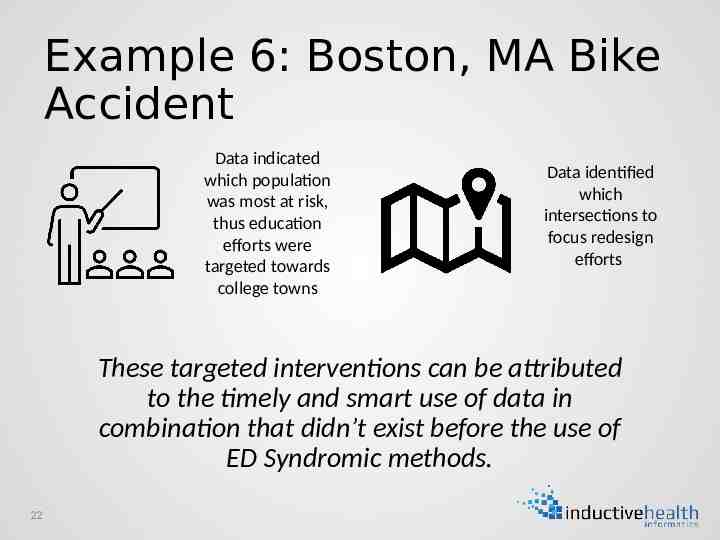
Example 6: Boston, MA Bike Accidents What does this all tell us? Bike injuries were highest among: 1) among out of Boston out of State; 2) white, 18-24-year-olds; 3) Allston/Brighton – a predominantly college town. 21 https://vimeo.com/39649953
Example 6: Boston, MA Bike Accident Data indicated which population was most at risk, thus education efforts were targeted towards college towns Data identified which intersections to focus redesign efforts These targeted interventions can be attributed to the timely and smart use of data in combination that didn’t exist before the use of ED Syndromic methods. 22
Example 6: Boston, MA Bike Accident Worked collaboratively with EMS and Community partners Combined data sets and used all available data (i.e. race and other demographics) to better characterize risk factors Communicated with community and partners Identified and worked with partners to change problematic intersection 23
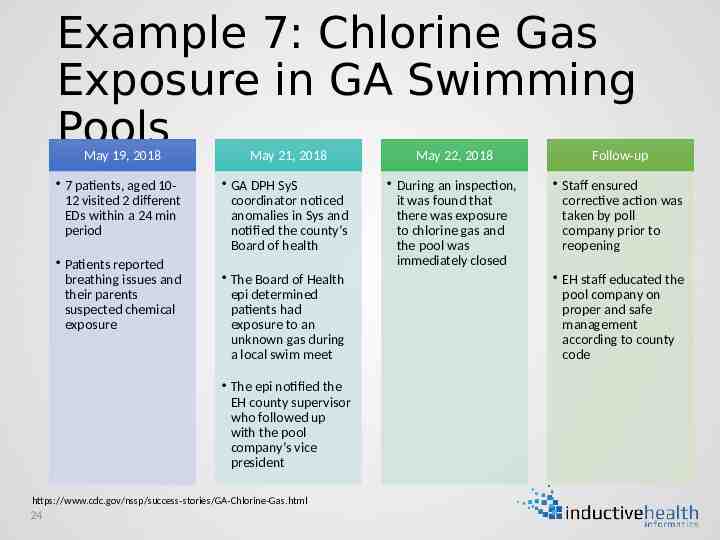
Example 7: Chlorine Gas Exposure in GA Swimming Pools May 19, 2018 May 21, 2018 May 22, 2018 Follow-up 7 patients, aged 1012 visited 2 different EDs within a 24 min period GA DPH SyS coordinator noticed anomalies in Sys and notified the county’s Board of health During an inspection, it was found that there was exposure to chlorine gas and the pool was immediately closed Staff ensured corrective action was taken by poll company prior to reopening Patients reported breathing issues and their parents suspected chemical exposure The Board of Health epi determined patients had exposure to an unknown gas during a local swim meet The epi notified the EH county supervisor who followed up with the pool company’s vice president https://www.cdc.gov/nssp/success-stories/GA-Chlorine-Gas.html 24 EH staff educated the pool company on proper and safe management according to county code
Example 7: Chlorine Gas Exposure in GA Swimming Pools Used alerting to identify cluster Worked across silos across state and local health departments Performed an investigation Educated pool owner and all other pool operators 25
The examples highlight key best practices 1 2 3 4 Stay alert and astute – don’t become complacent or negative about limitations Set up alerting capabilities for known situations Set up response protocol and follow through when alerted Characterize event & spread – use all data demographics , etc. 26 5 Identify and inform probable risk factors, causes, and exposures 6 Perform active case finding 7 8 Communicate with partners and public – especially with actions to take Be decisive with info you have – Act appropriately - Change environment / perform intervention
Summary I was recently asked – what can we do to help health departments take action? I’m hoping that these types of reviews of where action was taken will be helpful. We as public health professionals should guard against watching data go up and down and ask ourselves, “so what?” or “so what now?” – what can be done about what you see in the data? 27
Final Word Prerequisites Input Define Investigate Summarize Act Pre-event Event Post-event Don’t let perfection paralyze you Be curious Work iteratively Be creative Think about how syndromic can support/integrate Look for gaps that you may be able to fill 28
Additional Examples 29
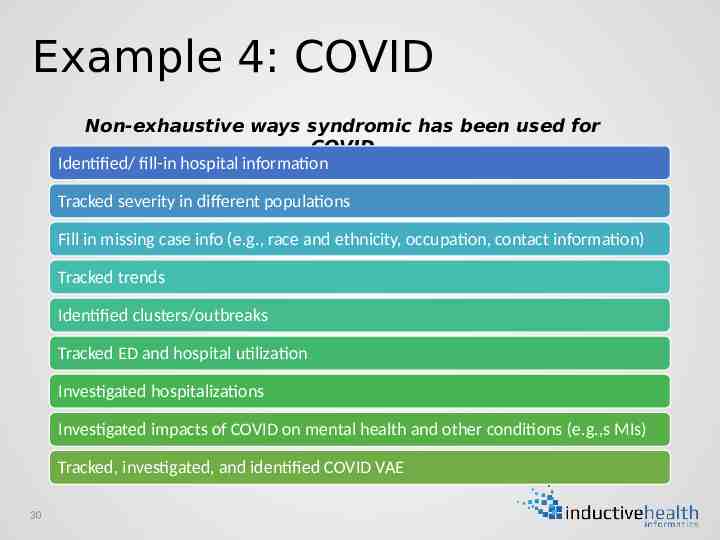
Example 4: COVID Non-exhaustive ways syndromic has been used for COVID Identified/ fill-in hospital information Tracked severity in different populations Fill in missing case info (e.g., race and ethnicity, occupation, contact information) Tracked trends Identified clusters/outbreaks Tracked ED and hospital utilization Investigated hospitalizations Investigated impacts of COVID on mental health and other conditions (e.g.,s MIs) Tracked, investigated, and identified COVID VAE 30
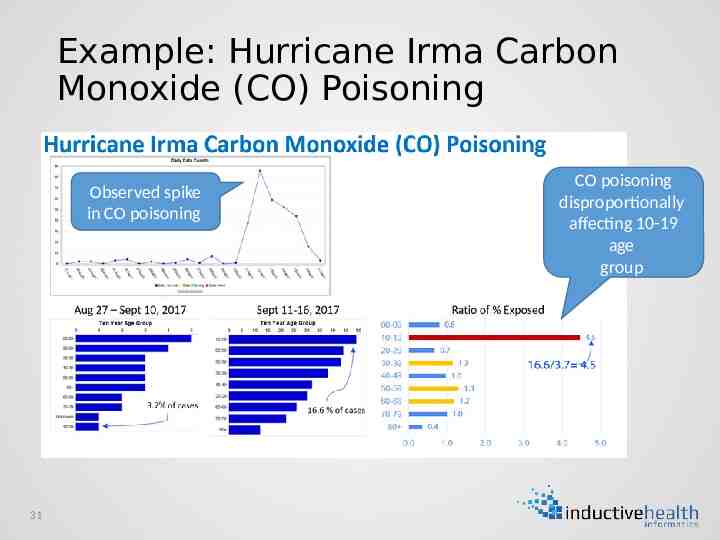
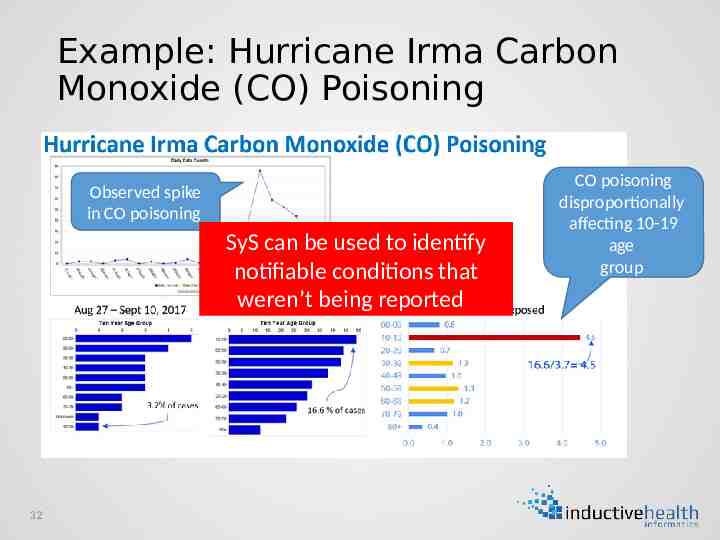
Example: Hurricane Irma Carbon Monoxide (CO) Poisoning Observed spike in CO poisoning 31 CO poisoning disproportionally affecting 10-19 age group
Example: Hurricane Irma Carbon Monoxide (CO) Poisoning Observed spike in CO poisoning SyS can be used to identify notifiable conditions that weren’t being reported 32 CO poisoning disproportionally affecting 10-19 age group
Additional SyS Examples Than Time to Describe Lead Poisoning surveillance in KS Electric Scooter surveillance in Austin, TX Firearm Injury surveillance in VA Monitoring Hurricane Displaced People in TN Wildfire surveillance in WA Agriculture Worker Injury surveillance in KS Follow-up Exposure to Bats in multiple states Identifying Unreported Reportable Conditions in multiple states Heat Dome surveillance in OR https://ojphi.org/ojs/index.php/ojphi/article/view/7695 ; https://communityimpact.com/austin/central-austin/transportation/2019/05/02/cdc-releases-results-ofscooter-study-finds-nearly-half-of-injuries-are-severe/ ; https://www.vdh.virginia.gov/surveillance-and-investigation/syndromic-surveillance/firearm-injurysurveillance/ ; https://www.cdc.gov/nssp/success-stories/TN-Population-Changes.html ; https://knowledgerepository.syndromicsurveillance.org/syndromicsurveillance-monitor-wildfire-events ; https://www.cdc.gov/nssp/success-stories/KS-Agricultural-Workers.html ; https://www.ncbi.nlm.nih.gov/pmc/articles/PMC5676512/) ; https://www.cdc.gov/nssp/success-stories/ks-rabies.html ; 33