SQL Server Query Optimizer Cost Formulas Joe Chang jchang6@yahoo qdpma


65 Slides1.13 MB
SQL Server Query Optimizer Cost Formulas Joe Chang [email protected] www.qdpma.com , www.solidq.com
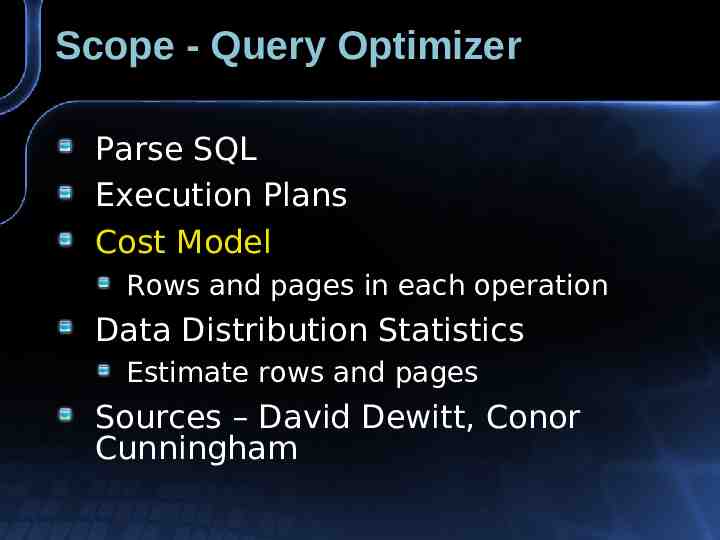
Scope - Query Optimizer Parse SQL Execution Plans Cost Model Rows and pages in each operation Data Distribution Statistics Estimate rows and pages Sources – David Dewitt, Conor Cunningham
Query Optimizer References Conor Cunningham Chapter in Inside SQL Server Conor vs. SQL http://blogs.msdn.com/b/ conor cunningham msft/ David Dewitt PASS 2010 Summit Keynote Search: Microsoft Jim Gray Systems Lab http://www.slideshare.net/GraySystemsLab/pass-summit-2010-keynotedavid-dewitt http://www.slideshare.net/GraySystemsLab/pass-summit-2010-keynotedavid-dewitt/download
My material http://www.qdpma.com/CBO/ SQLServerCostBasedOptimizer.html http://www.qdpma.com/ zPresentations.html
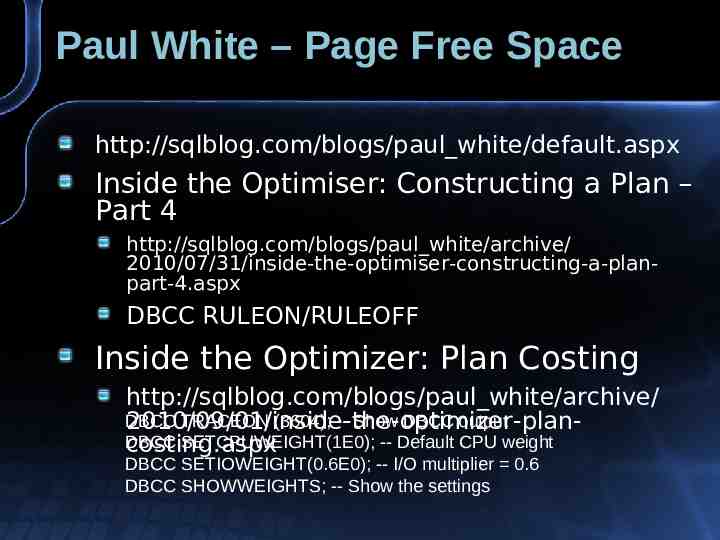
Paul White – Page Free Space http://sqlblog.com/blogs/paul white/default.aspx Inside the Optimiser: Constructing a Plan – Part 4 http://sqlblog.com/blogs/paul white/archive/ 2010/07/31/inside-the-optimiser-constructing-a-planpart-4.aspx DBCC RULEON/RULEOFF Inside the Optimizer: Plan Costing http://sqlblog.com/blogs/paul white/archive/ DBCC TRACEON (3604); -- Show DBCC output 2010/09/01/inside-the-optimizer-planDBCC SETCPUWEIGHT(1E0); -- Default CPU weight costing.aspx DBCC SETIOWEIGHT(0.6E0); -- I/O multiplier 0.6 DBCC SHOWWEIGHTS; -- Show the settings
Execution Plan Cost Model Index Seek Key Lookup – Table Scan Joins – Loop, Hash, Merge Updates (Includes Insert & Delete) Really complicated, not covered here Parallel Execution Plans
Why this is Useful? When does the QO use: an index versus table scan Loop Join or Hash/Merge with Scan? Is there a difference between the Cost Model and True Cost Structure? Should I use query hints Parallel Execution Strategy Modern servers – 64 cores
SQL Server Books Online Query Governor Cost Limit Query cost refers to the estimated elapsed time, in seconds, required to complete a query on a specific hardware configuration. Cost Threshold for Parallelism The cost refers to an estimated elapsed time in seconds required to run the serial plan on a specific hardware configuration. SQL Server creates and runs a parallel plan for a query only when the estimated cost to run a serial plan for the same query is higher than the value set in cost threshold for parallelism.
Adventure Works Example
Estimated Execution Plan
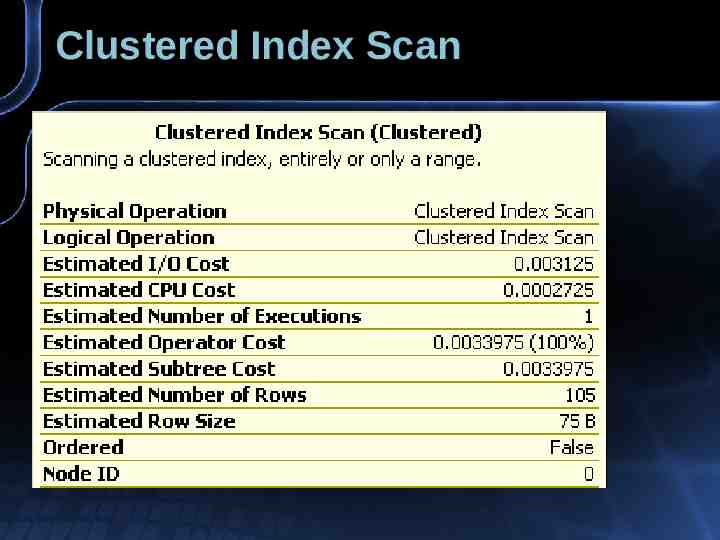
Clustered Index Scan
Index Seek
Index Seek Key Lookup
Heap Table
Heap Operations
The Formula – Seek, Scan (Clustered) Index Scan, Table Scan, Index Seek IO Cost 0.003125 0.00074074 per page CPU Cost 0.0001581 0.0000011 per row
Key Lookup (& Loop Join) Key/RID Lookup, Nested Loops Join IO Cost 0.003125 x % that require Lookup CPU Cost 0.0001581 per Lookup 0.0000011 per additional rows
IO Cost Model Sequential - Random Cost is elapsed time in seconds Random Sequential 0.003125 1/320 0.00074074 1/1350 Random: 320 IOPS Sequential 1350 pages/sec, or 10.8MB/s
Key Lookup – Scan Cross over Key Lookup rows to pages scanned ratio 1 Key Lookup cost approximately 4 pages in scan operation Non-parallel plan, with other costs Cross-over approx 3.5 pages per KL row Parallel Plan Closer to 4 pages per Key Lookup row
Loop, Hash and Merge Joins
LHM
Sort
Loop Hash and Merge Cost Fixed Loop 0.0 seek cost: 0.003125 IO, Incremental 0.00000418 Seek 0.0001581 CPU Hash 0.017780 Merge 0.005607 Many-to-Many Merge Sort 0.011261 0.00001526* 0.00000238† 0.00004738 * Hash incremental cost depends on inner/outer source size † Merge join incremental is per IS & OS row? Merge Sort fixed cost approx same as Hash fixed cost
Loop, Hash, Merge Cost Fixed Incremental Loop Zero High Hash High Medium Merge Medium Low Merge Join requires both source rows in index sorted order. Regular Merge only for 1-1 or 1-many Many-to-many merge join is more expensive
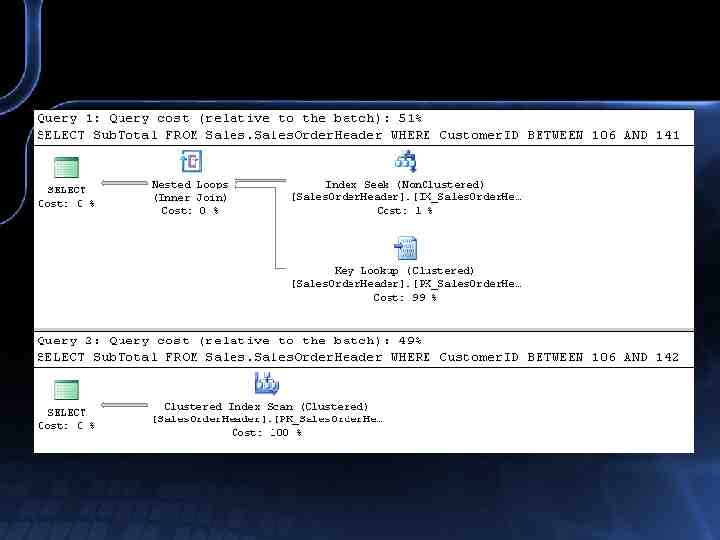
Plan Cross-over Theory Cost Index Seek Key Lookup Table Scan Rows
Theory & Actual? Cost KL Actual! KL Theory Table Scan KL alternate reality? Rows
Plan and Actual IO Random Sequential Ratio Plan 320 1,350 (10.8M/s) Current HD 200* 12,800 (100MB/s) 64* SAN 200 1,280 (10MB/s) 6.4 SSD 20,000 25,000 *Note: original slide incorrectly listed 640:1 4.2187 1
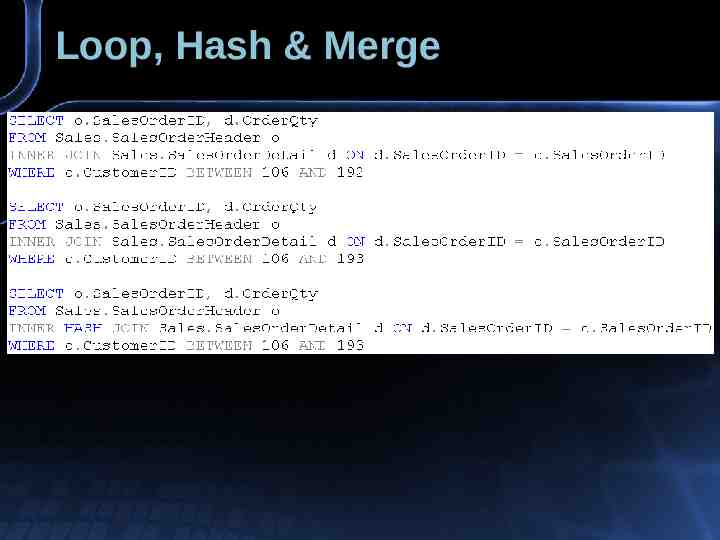
Loop, Hash & Merge
Loop Join
Merge Join
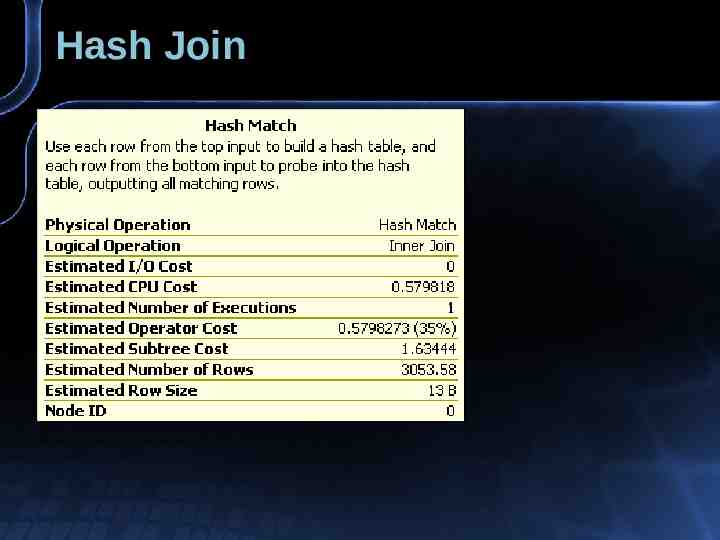
Hash Join
Insert, Update & Delete Really complicated See material from Conor For large number of rows (25%?) Consider dropping indexes
Delete Rows Index foreign keys when: Deletes from primary table are frequent
Parallel Execution Plans Parallel Execution Parallelism Gather, Repartition, Distribute Streams, Partitions
Parallel Execution Plan
Parallel Operations Distribute Streams Non-parallel source, parallel destination Repartition Streams Parallel source and destination Gather Streams Destination is non-parallel Bitmap
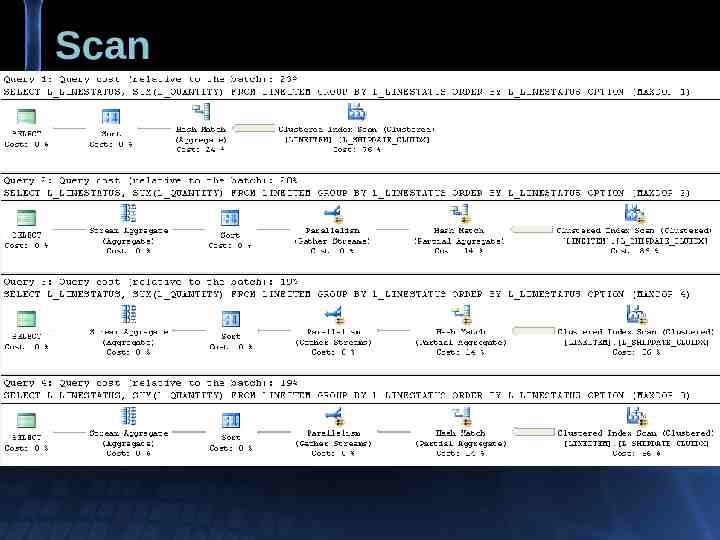
Scan
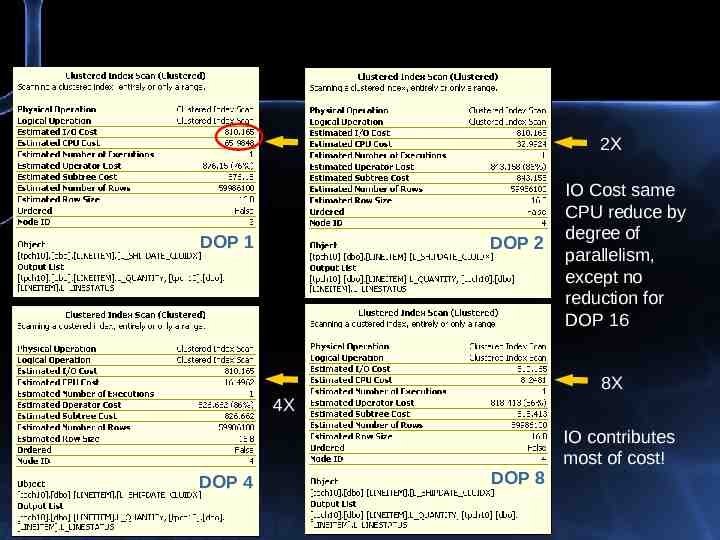
2X DOP 1 DOP 2 IO Cost same CPU reduce by degree of parallelism, except no reduction for DOP 16 8X 4X IO contributes most of cost! DOP 4 DOP 8
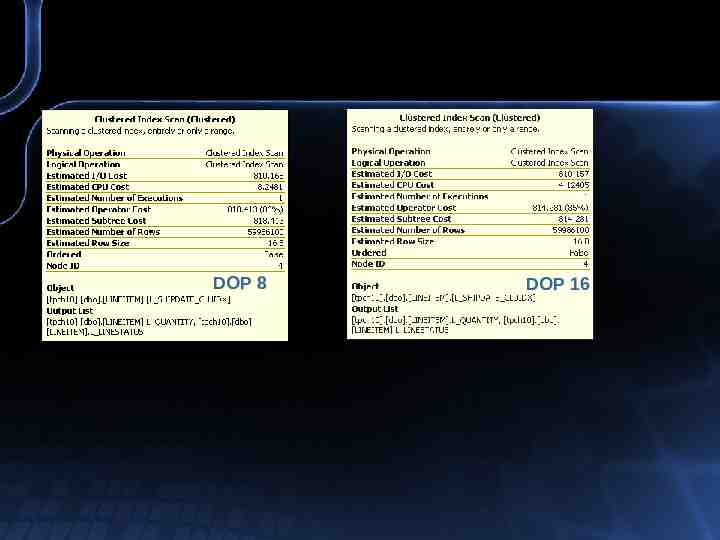
DOP 8 DOP 16
IO Cost is the same CPU cost reduced in proportion to degree of parallelism, last 2X excluded? On a weak storage system, a single thread can saturate the IO channel, Additional threads will not increase IO (reduce IO duration). A very powerful storage system can provide IO proportional to the number of threads. It might be nice if this was optimizer option? The IO component can be a very large portion of the overall plan cost Not reducing IO cost in parallel plan may inhibit generating favorable plan, i.e., not sufficient to offset the contribution from the Parallelism operations. A parallel execution plan is more likely on larger systems (-P to fake it?)
Partitioned Tables Regular Table Partitioned Tables No Repartition Streams operations!
Parallel Execution: Super Scaling Suppose at DOP 1, a query runs for 100 seconds, with one CPU fully pegged CPU time 100 sec, elapse time 100 sec What is best case for DOP 2? Assuming nearly zero Repartition Threads cost Super Scaling: CPU time decreases going from NonCPU time 100 sec, elapsed time Parallel to Parallel plan! 50? No, I have not been drinking, today, yet
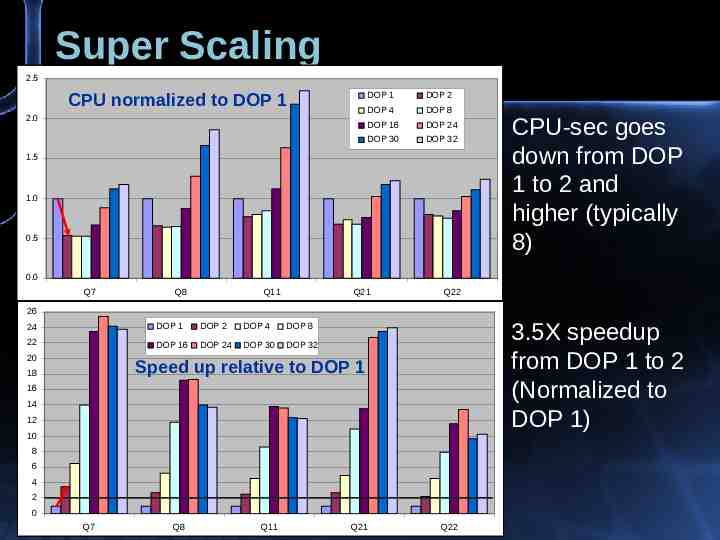
Super Scaling 2.5 CPU normalized to DOP 1 2.0 DOP 1 DOP 2 DOP 4 DOP 8 DOP 16 DOP 24 DOP 30 DOP 32 1.5 1.0 0.5 CPU-sec goes down from DOP 1 to 2 and higher (typically 8) 0.0 Q7 Q8 Q11 Q21 Q22 26 24 DOP 1 DOP 2 DOP 4 DOP 8 22 DOP 16 DOP 24 DOP 30 DOP 32 20 3.5X speedup from DOP 1 to 2 (Normalized to DOP 1) Speed up relative to DOP 1 18 16 14 12 10 8 6 4 2 0 Q7 Q8 Q11 Q21 Q22
Most probable cause Bitmap Operator in Parallel Plan Bitmap Filters are great, Question for Microsoft: Can I use Bitmap Filters in OLTP systems with non-parallel plans?
Negative Scaling 4.0 3.5 3.0 DOP 1 DOP 2 DOP 4 DOP 8 DOP 16 DOP 24 DOP 30 DOP 32 Query time 2.5 2.0 1.5 1.0 0.5 0.0 Q17 14 12 Q19 “Speedup” 10 Q20 Q22 DOP 1 DOP 2 DOP 4 DOP 8 DOP 16 DOP 24 DOP 30 DOP 32 8 6 4 2 0 Q17 Q19 Q20 Q22
CPU 12 10 DOP 1 DOP 2 DOP 4 DOP 8 DOP 16 DOP 30 DOP 24 DOP 32 8 6 4 2 0 Q17 Q19 Q20 Q22
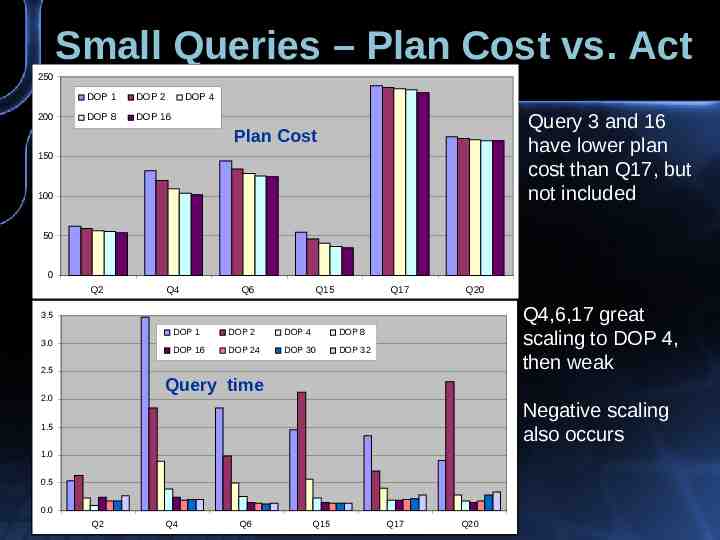
Small Queries – Plan Cost vs. Act 250 200 DOP 1 DOP 2 DOP 4 DOP 8 DOP 16 Query 3 and 16 have lower plan cost than Q17, but not included Plan Cost 150 100 50 0 Q2 Q4 Q6 Q15 Q17 Q20 Q4,6,17 great scaling to DOP 4, then weak 3.5 3.0 2.5 DOP 1 DOP 2 DOP 4 DOP 8 DOP 16 DOP 24 DOP 30 DOP 32 Query time 2.0 Negative scaling also occurs 1.5 1.0 0.5 0.0 Q2 Q4 Q6 Q15 Q17 Q20
6 CPU time 5 DOP 1 DOP 2 DOP 4 DOP 8 DOP 16 DOP 24 DOP 30 DOP 32 4 3 2 1 0 Q2 18 16 Q4 Q6 Q15 Speed up 14 Q17 Q20 DOP 1 DOP 2 DOP 4 DOP 8 DOP 16 DOP 24 DOP 30 DOP 32 12 10 8 6 4 2 0 Q2 Q4 Q6 Q15 Q17 Q20 What did I get for all that extra CPU?, Interpretation: sharp jump in CPU means poor scaling, disproportionate means negative scaling Query 2 negative at DOP 2, Q4 is good, Q6 get speedup, but at CPU premium, Q17 and 20 negative after DOP 8
Parallel Exec – Small Queries Why? Almost No value OLTP with 32, 64 cores Parallelism good if super-scaling Default max degree of parallelism 0 Seriously bad news, especially for small Q Increase cost threshold for parallelism?
Parallel Settings - Strategy Mostly for OLTP Cost Threshold for Parallelism Default: Plan Cost 5: Proposed: 20100 In 1997, Pentium Pro 200MHz, 5 sec for 50MB table (index range) scan Today, Xeon 5680, 3.3GHz, 30X faster Parallel plan could run 10-100 millisec
Parallel Settings - Strategy Mostly for OLTP Cost Threshold for Parallelism Default: Plan Cost 5: Proposed: 20100 In 1997, Pentium Pro 200MHz, 5 sec for 50MB table (index range) scan Today, Xeon 5680, 3.3GHz, 30X faster Parallel plan could run 10-100 millisec
Parallel Settings - Strategy Cost Threshold for Parallelism Default: Plan Cost 5: Proposed: 20100 In 1997, Pentium Pro 200MHz, 5 sec for 50MB table (index range) scan Today, Xeon 5680, 3.3GHz, 30X faster Parallel plan could run 10-100 millisec Max Degree of Parallelism (OLTP)
Too Many Indexes Complicates Query Optimization Too many possible execution plan Large Updates – Maintenance Consider dropping indexes
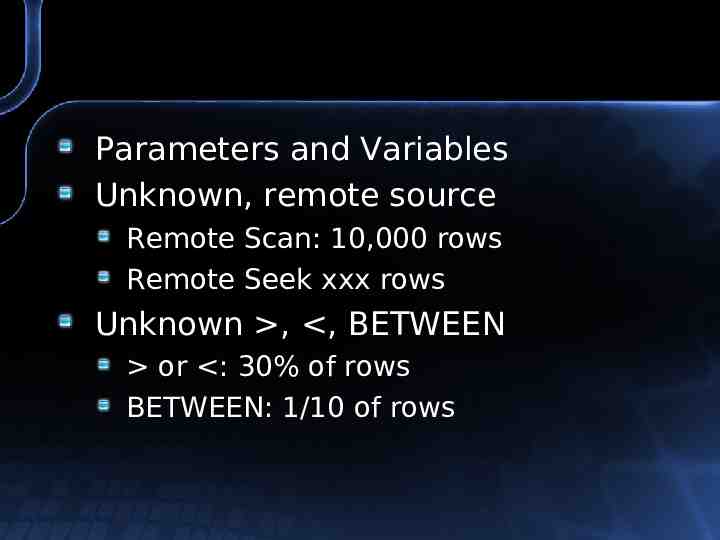
Parameters and Variables Unknown, remote source Remote Scan: 10,000 rows Remote Seek xxx rows Unknown , , BETWEEN or : 30% of rows BETWEEN: 1/10 of rows
Temp tables and Table Variables