Practical (Introduction to) Reverse Engineering Julio Auto
42 Slides566.25 KB
Practical (Introduction to) Reverse Engineering Julio Auto julio . auto *a* gmail
Agenda Part I - 101 Why this presentation? (I mean. WHY?!?!) A few concepts (Mumble jumble ) Demo (Show me the goods) Part II - 1337 Advancing RE (Do your own!) Something extra (Finish pretty – er. almost ) Linkz, lulz, refz, and shoutz Q & (maybe) A
Why? Suggested by the H2HC crew Based on my article ‘Cracking CrackMes’, published earlier this year while working for my previous employer, Scanit ME RE is getting lots of attention, and many people seem interested in learning it Still, it remains largely a black art
Why? (2) It seems, then, that moving up from ground zero is the most problematic step This presentation tries to help fix it It aims to expose instant useful knowledge And pointers to where go digging deeper Instead of advanced research results , basic techniques and processes Obs.: We’ll be targeting the Windows platform most of the time in this speech
Concepts Reverse Engineering is a very self- explicative term You take something and, from there, try to learn how (some aspect of) it was engineered It’s also obviously broad For example, it’s often used to describe the process through which you generate a higherlevel, architectural view of a piece of software given its source code
My Own Concept Think of the times you asked yourself “why” and “how” and let it go without an answer. . . . RE is not letting go
A Few Applications Malware Analysis Vulnerability Analysis Security Assessment of 3rd-party COTS Evaluation/Breaking of copy-protection schemes Assorted how’s and why’s
Why Still a Black Art? Perhaps because people think it’s only good for SW cracking Perhaps because DRM has become a nightmare no one is happy with and related laws everywhere bash reversers too hard every now and then (does anybody remember Dmitry Sklyarov, the DMCA and all that madness?) Perhaps because many people still think it should be illegal (wtf?!)
How To Learn The Crack-Me approach The one I illustrate in the paper I mentioned Small and targeted challenges with different levels and obstacles to choose from The real life approach Choose a real-world problem and attack it Tough but rewarding We’ll demo a bit of both
Tools of The Trade Probably millions of tools that can give you some useful piece of info about your target I’ll try to restrict myself to the most relevant/common, then Unfortunately, many of the best tools are commercial On the other hand, many of them have free/student/evaluation versions For the rest. Well, remember “the real life approach”? ;)
Debuggers Obvious importance Fairly good variety It’s nice to play and know your way with all of them But mastering them all is quite hard, so you’ll most likely elect your debugger of choice in little time Choose your debugger well!
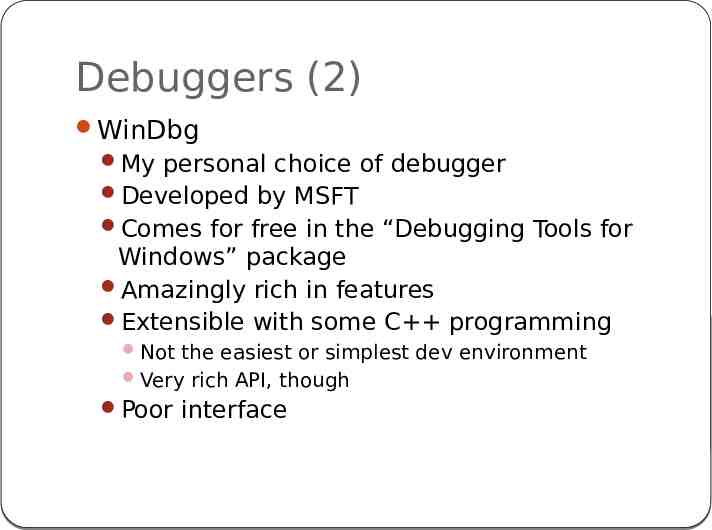
Debuggers (2) WinDbg My personal choice of debugger Developed by MSFT Comes for free in the “Debugging Tools for Windows” package Amazingly rich in features Extensible with some C programming Not the easiest or simplest dev environment Very rich API, though Poor interface
Debuggers (3) Visual Studio Debugger It’s crap, not suited for reversing But it’s pretty and nice for developers : Seriously, don’t try to go very far reversing with it It may use up the rest of your sanity
Debuggers (4) OllyDbg Enjoys quite a lot of popularity in the reversing community Nice interface In particular, a nice disassembly view Comes in a few “tuned” versions, being one of the most popular.
Debuggers (5) Immunity Debugger Developed by Immunity Inc. (someone from the dev team in the audience? ) Extends OllyDbg with a python interpreter and exposes a couple of debugging modules for the user to interact with Very neat plugin support Embeds a command-line with windbg-aliased commands Maintains a forum to support developers/users of ImmDbg plugins
Debuggers (6) gdb The standard debugger on *NIX systems Quite complete debugger Not the best thing in the RE world, but overall a good debugger
Disassemblers Reading assembly is not the sweetest thing for most people The way the code is represented is extremely important and makes an increasingly great difference in big RCE tasks Therefore, being confortable with your disassembler is essential
Disassemblers (2) Pretty much every debugger is capable of disassembling Apart of that, there’s lots of other tools that can do it too In Linux, objdump is pretty much a standard tool However, one particular tool is specially known for its disassembly features
Disassemblers (3) IDA Pro Supports many binary formats and architectures Displays the code in graphs, which greatly enhance the visualization Block-level CFGs Many things can be customized/adjusted Graph layout, data types, annotations. Quite frankly, it’s in every reverser’s toolkit IDA Pro is a commercial tool currently in version 5.3 But version 4.9 is available in a free edition
System Monitoring Tools All of those from the SysInternals Suite Process Explorer RegMon FileMon TCPView Etc.
Advanced Tools Binary Diff’ers BinDiff Decompilers Hex-Rays RE Frameworks ERESI ;) PaiMei and all the PyThings
Demo We’ll try and beat a crack-me challenge This crack-me was taken from a real competition HITB Dubai 2007 CTF Perhaps it can serve as a tip for H2HC’s CTF as well
RE – Advanced Topics Cutting to the chase, advancing RE basically means automating stuff Many of the RE tools are scriptable/programmable/extensible Developing smart ways to deal with repetitive tasks is the way for more effective analyses
RE – Advanced Topics (2) Less often, you might see opportunities to advance RE in ways not based on automation Defeating a new anti-debug trick Developing new environments for RE Virtualization, Sandboxing. Or even radically changing paradigms E.g. The graph-based approach to binary navigation
RE – Advanced Topics (3) Perhaps the most important lesson here is not to reinvent the wheel Re-use the tools you have! You’ll be amazed at how much stuff you can do by “glueing” pieces together Having that said. Perhaps the tools you have are not perfect Or you might wanna re-do something just for learning But be sure to have the right goals in mind!
Teaching By (Bad) Examples I wanted to do something really neat to show these concepts in practice Unfortunately, I didn’t manage to finish it in time The thing is currently under test/final touches However the idea is so cool and in such a (relatively) advanced state, that I decided to talk about it anyway
Problem Suppose you have ways to reproduce a high- profile, possibly exploitable bug – Yay! BUT. The target is closed-source software The target is as large and complex as an operating system – and way less documented The input is huge and has a complex, possibly undisclosed format The source of the bug can be anywhere in the input From user-input to actual bug/crash, about 3 million instructions happen
WHAT DO YOU DO?
Introducing LEP LEP tries to answer a big question in this problem: What exact part of this input is causing the bug? If you can answer this question and somehow co-relate this with the input format, you may gain a great deal of understanding of the bug For this, I have invented a new technique: “Staged Partial Tracing-Based Backwards Taint Analysis” Because not sounding like a Ph.D. is so 2001 :
Introducing LEP (2) One-liner idea: If we know when our input is brought to memory and know where it’s mapped, we can trace the program from this point to the crash and then go backwards analyzing the dataflow to find out where the faulting data came from We do it in two stages, with a component for each: the tracer and the analyzer Simple, huh?
Fundamental Concepts When we trace the program, it becomes “linear”, i.e. control-flow is irrelevant Dataflow becomes evident Aliasing is not an issue (in essence, it disappears) All info we need is available in runtime In particular, effective addresses If the input is as big as the problem states, it should be no problem to find it in memory We get most of the info we need from the disassembly text (ASCII)! It’s like hacking with grep again!
LEP Tracer A WinDbg extension Traces every instruction until the program raises an exception Dumps the following instruction info to a file: Mnemonic Destination operand Source operand Dependences of the source op – e.g. mov eax,[ecx edx*2]
LEP Tracer (2) Discards control-flow changing instructions Discards in/out instructions (all relevant input should be in memory already?) Discards other groups of instructions that will be supported as we go FPU, MMX, SSE{2,3}, etc. This might be one of the reasons it currently doesn’t work Tries to parse the right info even when the debugger is too stupid to work as expected Why not to compute effective addresses in rep’ed instructions?
LEP Analyzer Reads the file generated by the tracer and goes bottom-up investigating the dataflow You have to specify the piece of data that causes the last instruction to fail – usually (always?) a register And the memory range(s) where your input was mapped into, at the time the trace was taken Ignores register “slices” for simplicity al ah ax eax rax
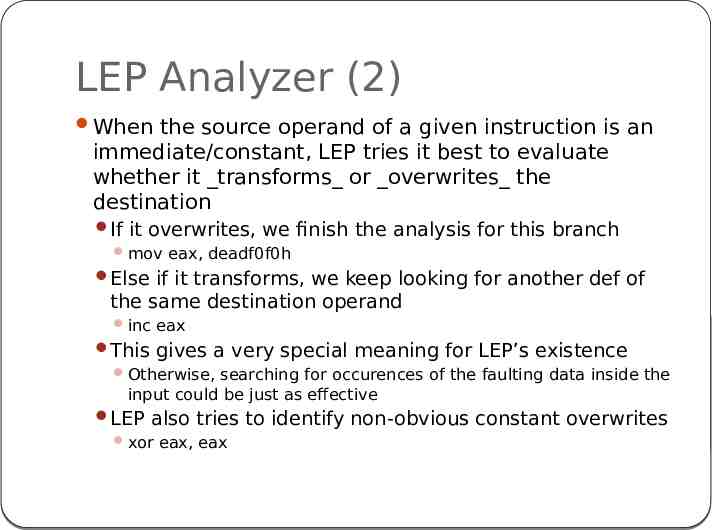
LEP Analyzer (2) When the source operand of a given instruction is an immediate/constant, LEP tries it best to evaluate whether it transforms or overwrites the destination If it overwrites, we finish the analysis for this branch mov eax, deadf0f0h Else if it transforms, we keep looking for another def of the same destination operand inc eax This gives a very special meaning for LEP’s existence Otherwise, searching for occurences of the faulting data inside the input could be just as effective LEP also tries to identify non-obvious constant overwrites xor eax, eax
Engineering Tech-Talk LEP was intended to be written entirely in Python Didn’t work for performance reasons LEP Tracer is written in C , since it’s a WinDbg extension It makes use of a reference of the x86 instruction set written in XML The XML is mapped to C using CodeSynthesis’ XSD XML Data Binding LEP Analyzer was firstly written in Python Then I also re-wrote it in C LEP Analyzer’s search algorithm was initially a DFS Then I implemented it as a BFS
Demo II Placeholder slide :
LEP Release As much as I like to make my software free and wide open, I have chosen not to release LEP to the public for now Instead, I’m willing to share it with whoever contacts me directly (by e-mail, for example) Basically, I just wanna know who is using it and what it’s gonna be used for Makes no difference if you come from Wall Street or from an underground cracking ghetto – drop me a line
Linkz & Refz Cracking CrackMes http://www.scanit.net/rd/wp/wp04 X86 Opcode and Instruction Reference, by MazeGen http://ref.x86asm.net/ CodeSynthesis XSD – XML Data Binding for C http://www.codesynthesis.com/products/xsd/ Thousands of elite RE projects http://www.google.com Seriously though, contact me if you can’t find anything
Greetz & Shoutz Filipe Balestra for lending me the bug used in the 2nd demo H2HC crew for letting me ruin their conference again The ERESI team, with whom I have most of my discussions about RE, programa analysis, etc All of the great people that I know from the security scene It’s simply impossible to mention each and everyone of you, but you know who you are!
Questions?
Practical (Introduction to) Reverse Engineering Julio Auto julio . auto *a* gmail

