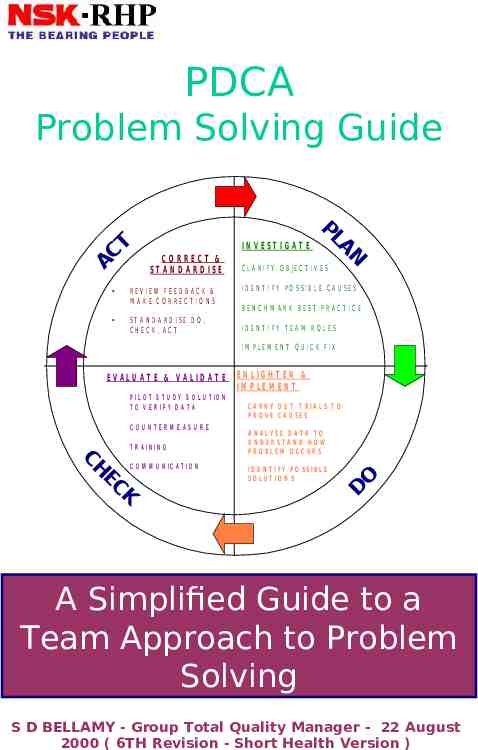
PDCA Problem Solving Guide T C A IN V EST IG A T E CO RRECT & ST A


20 Slides569.00 KB
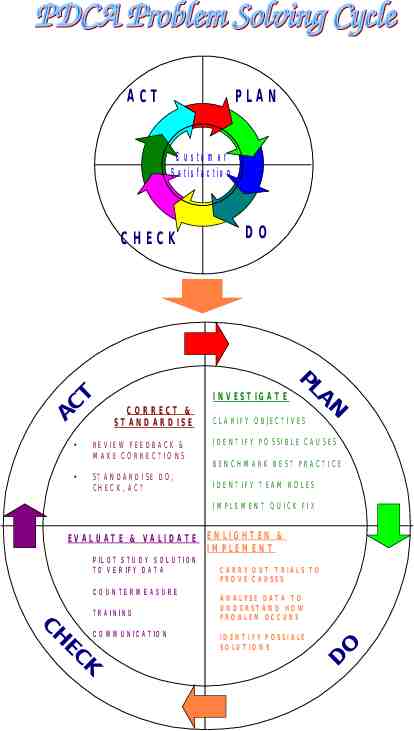
PDCA Problem Solving Guide T C A IN V EST IG A T E CO RRECT & ST A N D A R D ISE REVIEW FEED BACK & M A K E C O RRECT IO N S ST A N D A R D ISE D O , CH ECK , ACT PL AN C L A R I F Y O B JE C T I V E S ID EN T IFY PO SSIB L E C A U SES B EN C H M A R K B EST PR A C T IC E ID EN T IFY T EA M R O L ES IM PL EM EN T Q U ICK FIX EVALU AT E & VALID AT E P IL O T S T U D Y S O L U T IO N T O V E R IF Y D A T A COUNTERM EASURE CH EC C O M M U N I C A T I O N K T R A IN IN G EN LIG H T EN & IM PLEM EN T CAR RY O U T T R IA LS T O PR O VE C A U SE S A N A LY SE D A T A T O U N D E R ST A N D H O W PR O BLEM O CCU R S ID E N T IFY PO SSIB L E SO L U T IO N S O D A Simplified Guide to a Team Approach to Problem Solving S D BELLAMY - Group Total Quality Manager - 22 August 2000 ( 6TH Revision - Short Health Version )
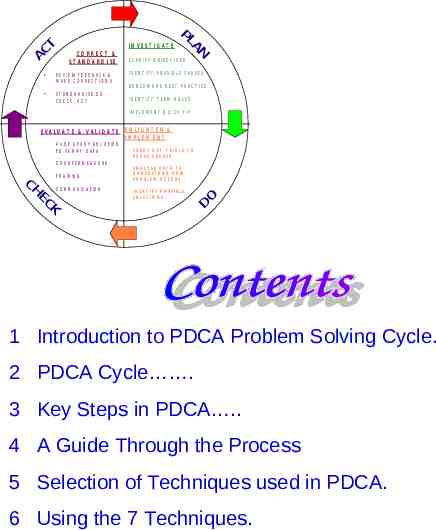
AC T REVIEW FEED BA CK & M AK E C O R RECT IO N S ST A N D A R D ISE D O , CH ECK , ACT AN PL IN V E ST IG A T E CO RRECT & ST A N D A R D ISE C L A R I F Y O B JE C T I V E S ID EN T IFY P O SSIB L E C A U SES B EN C H M A R K B EST PR A C T IC E ID EN T IFY T EA M R O L ES IM PL EM EN T Q U ICK FIX P IL O T S T U D Y S O L U T IO N T O V E R IF Y D A T A COUNTERM EASURE T R A IN IN G K EC CH C O M M U N IC A T IO N EN LIG H T EN & IM PLEM EN T CA RR Y O U T T RIALS T O PR O VE C A U SES A N A LY SE D A T A T O U N D E R ST A N D H O W PR O BLEM O CCU R S ID EN T IFY PO SSIB LE SO L U T IO N S D O EVALU AT E & VALID AT E 1 Introduction to PDCA Problem Solving Cycle. 2 PDCA Cycle . 3 Key Steps in PDCA . 4 A Guide Through the Process 5 Selection of Techniques used in PDCA. 6 Using the 7 Techniques.
AC T R EV IEW FEED B A CK & M A K E C O R R EC T IO N S ST A N D A R D ISE D O , C H ECK , ACT AN PL IN V E ST IG AT E CO RRECT & ST A N D A R D ISE C L A R I F Y O B JE C T I V E S ID EN T IFY P O SSIB L E C A U SE S B EN C H M A R K B EST PR A C T IC E ID EN T IFY T EA M R O LES IM PLEM EN T Q U ICK FIX P IL O T S T U D Y S O L U T IO N T O V E R IF Y D A T A CO UN TER M E ASURE T R A IN IN G K EC CH C O M M U N IC A T IO N C A R R Y O U T T R IA LS T O PR O VE C A U SE S A N A LY SE D A T A T O U N D ER ST A N D H O W PRO BLEM O CCU RS ID EN T IFY PO SSIB LE SO LU T IO N S D O EVALU AT E & VALID AT E EN LIG H T EN & IM PLEM EN T PDCA was created by W Edwards Deming in the 1950’s as an easy to follow Problem Solving Cycle. Deming was tasked with helping Japan rebuild its economy in the 1950’s. His purpose was to use PDCA with a Continuous Improvement process to help rebuild Japanese industries so that they could compete in the world market in the future.
ACT PLAN C u s to m e r S a t is f a c t io n CHECK T C A DO IN V EST IG A T E CO RRECT & ST AN D A R D ISE REV IEW FEED B A C K & M A K E C O RR EC T IO N S ST A N D A R D ISE D O , CH ECK , ACT PL AN C L A R I F Y O B JE C T I V E S ID EN T IFY PO SSIB L E C A U SES B EN C H M A R K B EST PR A C T IC E ID EN T IFY T EA M RO LES IM PLEM EN T Q U ICK FIX EVALU AT E & VALID AT E P IL O T S T U D Y S O L U T IO N T O V E R IF Y D A T A COUNTERM EASURE CH EC C O M M U N I C A T I O N K T R A IN IN G EN LIG H T EN & IM PLEM EN T CA R R Y O U T T R IA LS T O PR O VE C A U SE S A N A LY SE D A T A T O U N D E R ST A N D H O W PRO BLEM O CCU RS ID E N T IFY PO SSIBLE SO LU T IO N S O D
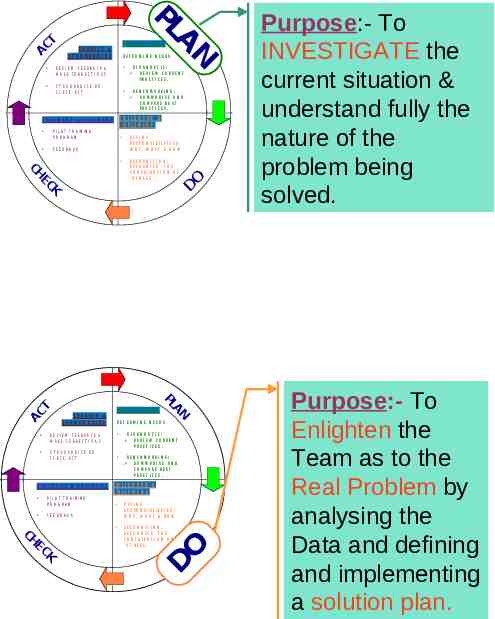
DETERM I N E N EEDS ST A N DA RDI S E DO , CH ECK, A CT P IL O T T R A IN IN G PRO G RAM FEEDBACK A CT BEN CH M A RKI N G: S U M M A RI S E A N D C O M PA R E B E S T PR A C T I C E S . DEFI N E R E S PO N S I B I L I T I E S : W HY, W HAT & HO W RECO GN I T I O N . RECO GN I S E T H E CO N T RI BU T I O N O F O T HERS. D O CO RRECT & S T A N DA RDI SE REVI EW FEED BA CK & M A KE CO RRECT I O N S ST AN DARDI SE DO , CH ECK, A CT E VA LU A T E & VA LI D A T E P IL O T T R A IN IN G PRO G RAM FEEDBACK IN VESTIGAT E N A PL EN LI GH T EN & I M PLE M E N T K EC CH DI A GN O S T I C: REVI EW CURREN T PR A C T I C E S . EVA LU A T E & VA LI DA T E DET ERM I N E N EEDS DI A GN O S T I C: REVI EW CURREN T PR A C T I C E S . BEN CH M A RKI N G: S U M M A RI S E A N D C O M PA R E B E S T PR A C T I C E S . EN LI GH T EN & I M PLE M E N T K EC CH DEFI N E R E S PO N S I B I L I T I E S : W HY, W HAT & HO W RECO GN I T I O N . RECO GN I SE T H E CO N T RI BU T I O N O F O T H ERS . D O A CT CO RRECT & S T A N DA RDI S E REVI EW FE ED BA CK & M A KE CO R RE CT I O N S N A PL IN VEST IGATE Purpose:- To INVESTIGATE the current situation & understand fully the nature of the problem being solved. Purpose:- To Enlighten the Team as to the Real Problem by analysing the Data and defining and implementing a solution plan.
Purpose:- To monitor effect of implementation of project plan & find Countermeasures to further improve the solution. Purpose:- To Review Continuously the Performance Measure & make adjustments as required. Integrate new situation into Normal Working Practice. Start PDCA Cycle again. CT A I N VEST IGAT E CO RRECT & S T A N DA RDI S E DET ERM I N E N EEDS ST AN DARDIS E DO , CH ECK, A CT FEEDBACK T C A CO RRECT & S T A N DA RDI S E REVI EW FEEDBA CK & M A KE CO RRECT I O N S ST AN DARDI SE DO , CH ECK , A CT EVA LU A T E & VA LI DA T E P IL O T T R A IN IN G PRO G RAM FEEDBACK CH EC K BEN CH M A RKI N G: S U M M A RI SE A N D C O M PA R E B E S T PR A C T I C E S . EN LI GH T EN & I M PL E M E N T CH EC K DI A GN O S T I C: REVI EW CU RREN T PR A C T I C E S . EVA LU A T E & VA LI DA T E P IL O T T R A IN IN G PRO G RAM REV I EW F EED BA CK & M A KE CO RRECT I O N S PL A N DEFI N E R E S PO N S I B I L I T I E S : W H Y, W HA T & H O W RECO GN I T I O N . RECO GN I S E T H E CO N T RI BU T I O N O F O T H ERS. I N VESTIGA TE DO PL A N DET ERM I N E N EEDS DI A GN O ST I C: REVI EW CU RREN T PR A C T I C E S . BEN CH M A RKI N G: SUM M A RI SE A N D C O M PA R E B E S T PR A C T I C E S . EN LI GH T EN & I M PL E M E N T DEFI N E R E S PO N S I B I LI T I E S : W H Y, W HAT & H O W RECO GN I T I O N . RECO GN I S E T H E CO N T RI BU T I O N O F O T H ERS . O D
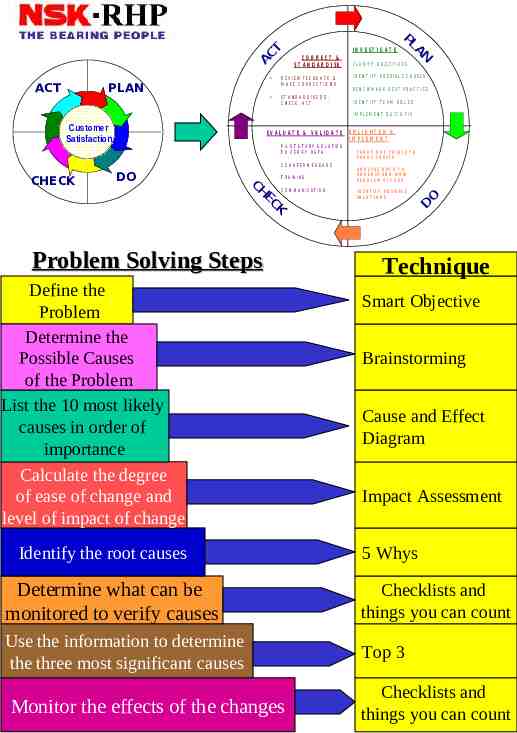
T AC ACT PLAN IN V E ST IG A T E CO RRECT & ST A N D A R D ISE R EV IEW FEED B ACK & M A K E CO R RECT IO N S ST A N D A R D ISE D O , CH ECK , ACT PL AN C L A R I F Y O B JE C T I V E S ID EN T IFY PO SSIB L E C A U SES B EN C H M A R K B EST P R A C T IC E ID EN T IFY T EAM R O LES IM PLEM EN T Q UIC K FIX Customer Satisfaction EVALU AT E & VALID AT E P IL O T S T U D Y S O L U T IO N T O V E R IF Y D A T A COUNTERM EASURE CHECK DO CH T R A I N I N G EC C O M M U N I C A T I O N K Problem Solving Steps Define the Problem Determine the Possible Causes of the Problem List the 10 most likely causes in order of importance Calculate the degree of ease of change and level of impact of change Identify the root causes EN LIG H T EN & IM PLEM EN T CA R R Y O U T T R IA LS T O P R O VE C A U SE S A N A LY SE D A T A T O U N D E R ST A N D H O W PRO BLEM O CCU RS ID EN T IFY PO SSIB LE SO L U T IO N S O D Technique Smart Objective Brainstorming Cause and Effect Diagram Impact Assessment 5 Whys Determine what can be monitored to verify causes Checklists and things you can count Use the information to determine the three most significant causes Top 3 Monitor the effects of the changes Checklists and things you can count
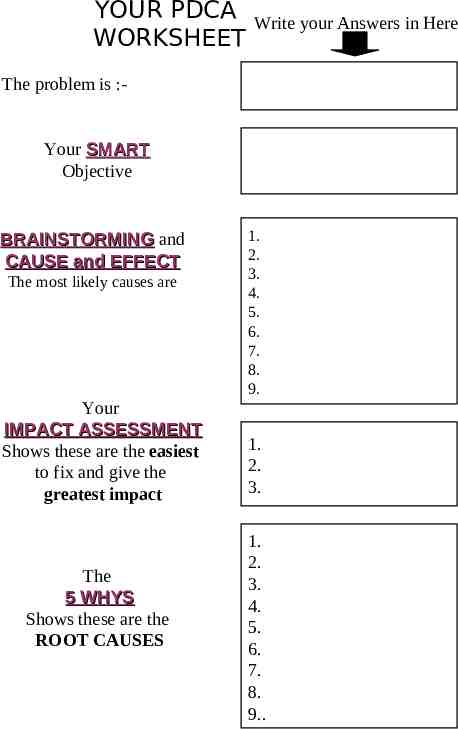
YOUR PDCA WORKSHEET Write your Answers in Here The problem is :- Your SMART Objective BRAINSTORMING and CAUSE and EFFECT The most likely causes are Your IMPACT ASSESSMENT Shows these are the easiest to fix and give the greatest impact The 5 WHYS Shows these are the ROOT CAUSES 1. 2. 3. 4. 5. 6. 7. 8. 9. 1. 2. 3. 1. 2. 3. 4. 5. 6. 7. 8. 9.
YOUR PDCA WORKSHEET - Page 2 Write your Answers in Here These methods have been used to collect data The TOP 3 causes to be tackled have been identified from the data collected 1. 2. 3. 4. 5. 1. 2. 3. These methods have been used to Monitor the Effect of Any Changes 1. 2. 3. 4. 5.
A CT PL A N Techniques to use with PDCA Selection Chart C u s to m e r S a tis fa c tio n CH ECK DO Technique 1 SMART OBJECTIVE 2 BRAINSTORMING 3 CAUSE & EFFECT 4 IMPACT ASSESSMENT 5 6 5 WHY'S CHECKLISTS AND THINGS YOU CAN COUNT 7 TOP 3 ANALYSIS P D C A
PL A N A CT Defining the Problem in C u s to m e r S a t is f a c t io n CH ECK DO SMART form. What is this ? It is the first step in the PDCA problem solving cycle. Why do it ? To ensure that the whole Team is clear about what their Goal is. When do I use it ? At the first Team meeting. Who does this ?. ? The Team. How de we do it ? By considering each of the following aspects of the issue being addressed. Who is the problem experienced by ( Stakeholder )? What is the problem ? Where is the problem ? When is the problem experienced ? Use these statements as a “Sanity Check” to refer back to at later stages of the project to check if on track.
PL A N A CT C u s to m e r S a t is f a c t io n CH ECK DO Writing a Team Mission Statement in SMART form. Write a statement using the following SMART rules. Specific Measurable Achievable Realistic Time based Examples To reduce “Annual Lost working Days due to Back related Problems” in the “Stores Department” by 50% in 6 months. To reduce “Risk of causing Back Related Injuries” in the Packing Department by 30% in 5 days.
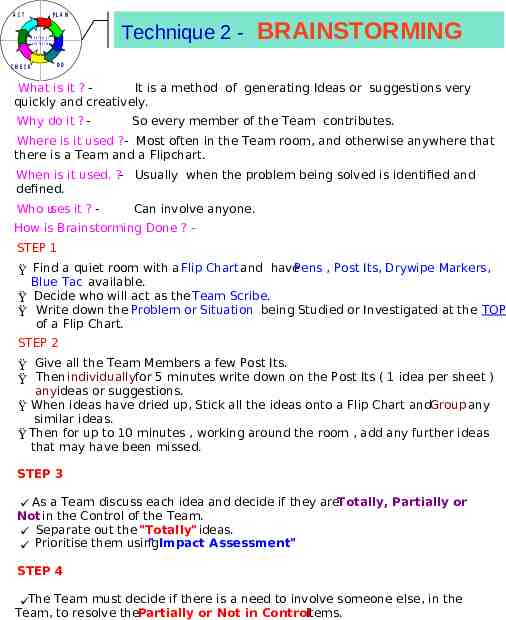
A CT PL A N C u s to m e r S a tis f a c tio n CH ECK Technique 2 - BRAINSTORMING DO What is it ? It is a method of generating Ideas or suggestions very quickly and creatively. Why do it ? - So every member of the Team contributes. Where is it used ?- Most often in the Team room, and otherwise anywhere that there is a Team and a Flipchart. When is it used. ?- Usually when the problem being solved is identified and defined. Who uses it ? - Can involve anyone. How is Brainstorming Done ? STEP 1 Ÿ Find a quiet room with a Flip Chart and havePens , Post Its, Drywipe Markers, Blue Tac available. Ÿ Decide who will act as the Team Scribe. Ÿ Write down the Problem or Situation being Studied or Investigated at the TOP of a Flip Chart. STEP 2 Ÿ Give all the Team Members a few Post Its. Ÿ Then individuallyfor 5 minutes write down on the Post Its ( 1 idea per sheet ) anyideas or suggestions. Ÿ When ideas have dried up, Stick all the ideas onto a Flip Chart andGroup any similar ideas. Ÿ Then for up to 10 minutes , working around the room , add any further ideas that may have been missed. STEP 3 As a Team discuss each idea and decide if they areTotally, Partially or Not in the Control of the Team. Separate out the "Totally" ideas. " Impact Assessment" Prioritise them using STEP 4 The Team must decide if there is a need to involve someone else, in the Team, to resolve thePartially or Not in Controlitems.
A CT PL A N Technique 3 - CAUSE & EFFECT C u s to m e r S a tis fa c tio n CH ECK DO What is it ? - It is a method ofBrainstorming Causes of a problem or situation. Why do it ?To - help the Team can focus on specific themes and groups of causes . Where is it used ?- In the team room or at place of work When do we use it -?When a problem or effect is defined and possible causes are needed. Who uses it ? - Everyone. How do we use them ? Step 1 - On a large board or flip chart. MAN Construct the diagram below. MACHINE Write the Effect in here. METHOD MATERIAL Step 2 - A Scribe Will take POSSIBLE CAUSESfrom round the table in Turn until Dried up. As per example below. MEN Operator not Trained Machines Lifting Equipment unavailable Lack of space in cab Back Pain Boxes too heavy Boxes not labelled Methods Materials Heavy boxes in difficult locations. No Post bore Gauge Step 3 -Prioritise and Select those to be investigated, by allocating VOTES to each Team member who add their choices to the Diagram . As per Diagram Below. MEN 3 Machines Operator not Trained Lifting Equipment unavailable Scales in wrong place 5 1 Back Pain Boxes too heavy Boxes not labelled Materials 2 Heavy boxes in difficult locations Scales in wrong place Methods 8
A CT PL A N Technique 4 - IMPACT ASSESSMENT. C u s to m e r S a tis f a c tio n CH ECK DO What Is It ? - It is a method by which the Team can identify the priorities of a large list of Ideas/actions or Causes. Why use it ? -To get a Team Consensus and get the greatest Impact with least effort. When is it used? - In cases where the is a long list of items. Where is it used? - Team Meetings How is it done? Step1 Write all of the possible causes on to a flip chart and then the Team Members should (by agreement) rank against 2criteria 1 The EASE of achieving ( 1 Very Difficult to 10 Very Easy ), and 2 The IMPACT of the result ( 1 Very Low to 10 Very High ) on the problem. 3. The EASE and IMPACT are then multiplied together and the items with the highest score are investigated first. Cause Ease Impact Score Boxes too Heavy 4 8 32 Boxes weight not marked 6 5 30 Heavy weights in poor position 9 8 72 Shelf height set too high 10 5 50 Examine this option first
A CT PL A N Technique 5 - 5 WHY’s C u s to m e r S a tis f a c tio n CH ECK DO What is it ? - A very simple way of finding out if the team has reached the ROOT CAUSE of a problem. Why use it ? - To confirm the team perception Where is it used ? - As part of a team problem solving sessions When is it used ? - After initial brainstorming and defining a problem. Who uses it ? - The team. How do we use it ? - 5 - Why's Simply ask the question 5 times "WHY" 1) WHY will TV not come on ? Because there is no power. 2) WHY is there no power? Because the fuse has blown. 3) WHY has the fuse blown.? Because the fuse amp rating is to low. 4) WHYwas the fuse amp rating too low? Because it was incorrectly selected. 5) WHY was it incorrectly selected? Because the house holder was ignorant understanding) of the need for correct selection.
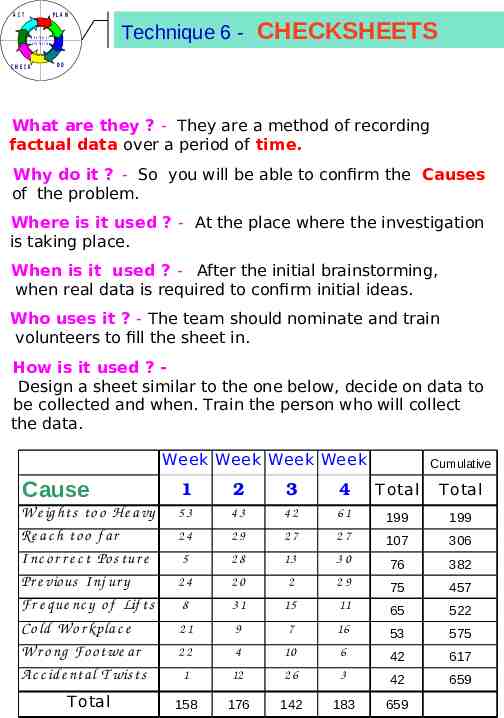
A CT PL A N C u s to m e r S a tis f a c tio n CH ECK Technique 6 - CHECKSHEETS DO What are they ? - They are a method of recording factual data over a period of time. Why do it ? - So you will be able to confirm the Causes of the problem. Where is it used ? - At the place where the investigation is taking place. When is it used ? - After the initial brainstorming, when real data is required to confirm initial ideas. Who uses it ? - The team should nominate and train volunteers to fill the sheet in. How is it used ? Design a sheet similar to the one below, decide on data to be collected and when. Train the person who will collect the data. Week Week Week Week Cumulative Cause 1 2 3 4 T otal T otal W e ig ht s to o H e a vy Re a c h to o f a r I nc o r r e c t Po s tur e Pr e vio us I nj ur y Fr e q ue nc y o f Lif t s Co ld W o r kpla c e W r o ng Fo o twe a r Ac c id e nta l T wis ts 53 43 42 61 199 199 24 29 27 27 107 306 5 28 13 30 76 382 24 20 2 29 75 457 8 31 15 11 65 522 21 9 7 16 53 575 22 4 10 6 42 617 1 12 26 3 42 659 T otal 158 176 142 183 659
A CT PL A N C u s to m e r S a tis f a c tio n CH ECK DO Technique 6 - CHECKSHEETS - Postural Assessment and Remedy Forms What are they Forms ? to help to identify areas of concern within a task and to suggest solutions Why do it To ? compare the task against standards to determine Real areas of concern and solutions Where is it used ?In the work place When is it used ?As part of finding the cause of the problem Who uses it ?The workforce and steering group How is it used ? By - observation in the workplace CHECK LIST TO MONITOR MANUAL HANDLING POSTURES Job assessed: Task assessed: Stressful Posture Score Comments Bending Height of load Floor to knee height 10 Knee to hip height 5 Hip to elbow height 0 Elbow to shoulder height 5 Use the Checklist to determine areas of concern (Assess.doc) SUGGESTED REMEDIES FOR STRESSFUL MANUAL HANDLING DRAFT ISSUE POSSIBLE CAUSES BENDING Working Height Physical Obstruction See if the remedy sheet helps to remove the concern. Access POSSIBLE REMEDIES Work too low Raise height of work surface Lower position of operator Work surface too wide Position task nearer operator Make work surface narrower Object between operator and task Remove object Provide access around object Operator unable to access all sides of the task Make accessible space all around the task Rotate the task e.g.turntable Position of labels, instructions Operator has to bend to read labels Position labels for ease of reading Barcoding Restricted workspace Operator unable to adopt safe posture Provide sufficient space for operator to adopt safe working posture
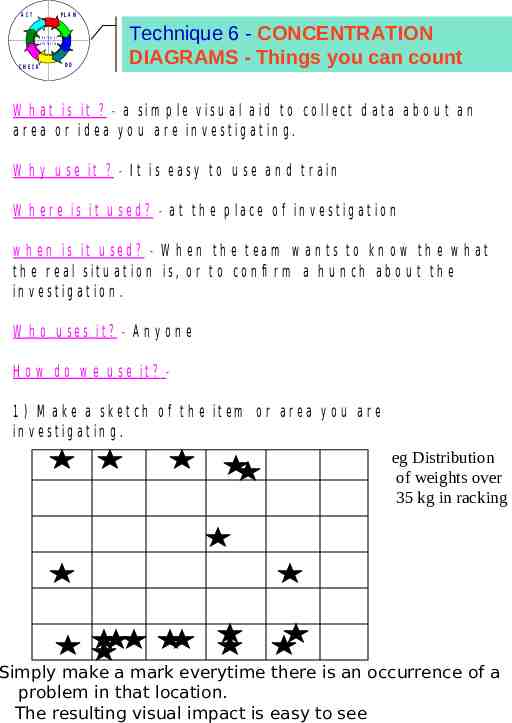
A CT PL A N C u s to m e r S a tis f a c tio n CH ECK DO Technique 6 - CONCENTRATION DIAGRAMS - Things you can count W h a t is it ? - a sim p le v isu a l a id t o co lle ct d a t a a b o u t a n a r e a o r id e a y o u a r e in v e st ig a t in g . W h y u se it ? - I t is e a sy t o u se a n d t r a in W h e r e is it u se d ? - a t t h e p la ce o f in v e st ig a t io n w h e n is it u se d ? - W h e n t h e t e a m w a n t s t o k n o w t h e w h a t t h e r e a l s i t u a t i o n i s , o r t o c o n fi r m a h u n c h a b o u t t h e in v e st ig a t io n . W h o u se s it ? - A n y o n e H o w d o w e u se it ? 1 ) M a k e a sk et ch o f t h e it em o r a r ea y o u a r e in v e st ig a t in g . eg Distribution of weights over 35 kg in racking Simply make a mark everytime there is an occurrence of a problem in that location. The resulting visual impact is easy to see
A CT PL A N Technique 7 - TOP 3 C u s to m e r S a tis f a c tio n CH ECK DO What is it ? - A method of determining what areas to concentrate on Why do it ? -This is based on pareto analysis where 80%of the problem is caused by only a few causes Where is it usedOn ? -notice boards, in departments at place of work to show why things are being tackled. When is it used ? checksheet form. Who uses it ? - After you have collected real data in Anyone. How do we use it ? ( Using data in technique 3. ) Week Week Week Week Cause Weights too Heavy Reach Too far Incorrect Posture Previous Injuries Frequency of Lifts Cold Workplace Wrong Footwear Accidental Twists Total Cumulative Total % % 199 199 30.19727 30.1972686 27 107 306 16.23672 46.4339909 13 30 76 382 11.53263 57.9666161 20 2 29 75 457 11.38088 69.3474962 8 31 15 11 65 522 9.863429 79.2109256 21 9 7 16 53 575 8.042489 87.2534143 22 4 10 6 42 617 6.373293 93.6267071 1 12 26 3 42 659 6.373293 100 158 176 142 183 659 1 2 3 4 53 43 42 61 24 29 27 5 28 24 Total Examine the issues in RED first (3 highest values ) Cumulative ar In co rre ct Po stu re Pr ev iou sI nju rie s Fr eq ue nc yo fL if t s Co ld W ork p la ce W ron gF oo tw ea r Ac c id en ta lT wi st s oo f hT Re ac W eig ht st oo He av y 100 90 80 70 60 50 40 30 20 10 0