New York PIP Insurance Update: Is New York’s No-Fault Crisis Solved?


19 Slides426.50 KB
New York PIP Insurance Update: Is New York’s No-Fault Crisis Solved? Insurance Information Institute June 2, 2005 Robert P. Hartwig, Ph.D., CPCU, Senior Vice President & Chief Economist Insurance Information Institute 110 William Street New York, NY 10038 Tel: (212) 346-5520 Fax: (212) 732-1916 [email protected] www.iii.org
NY PIP UPDATE Is New York’s No-Fault System Truly Under Control?
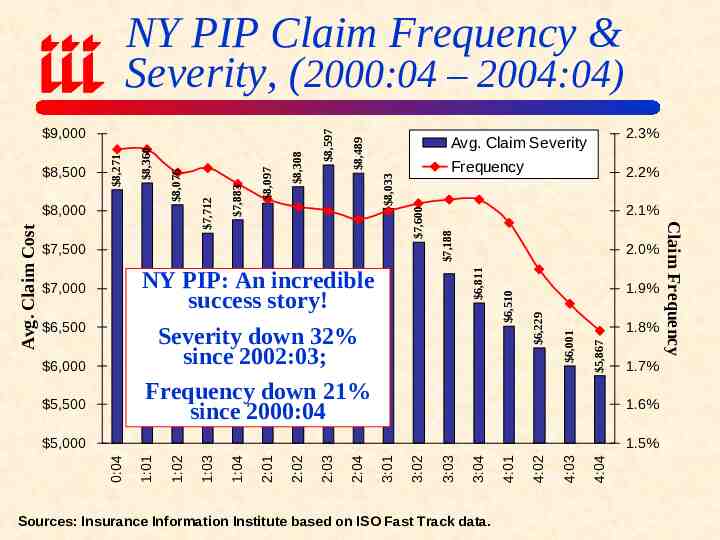
8,489 2.1% 5,500 1.8% 5,867 6,229 6,510 1.9% 6,001 6,000 2.0% 6,811 NY PIP: An incredible success story! Severity down 32% since 2002:03; Frequency down 21% since 2000:04 6,500 2.2% 7,188 7,600 8,033 8,308 8,097 7,883 Frequency 7,500 7,000 2.3% Avg. Claim Severity 1.7% 1.6% Sources: Insurance Information Institute based on ISO Fast Track data. 4:04 4:03 4:02 4:01 3:04 3:03 3:02 3:01 2:04 2:03 2:02 2:01 1:04 1:03 1:02 1:01 1.5% 0:04 5,000 Claim Frequency Avg. Claim Cost 8,000 7,712 8,076 8,360 8,500 8,271 9,000 8,597 NY PIP Claim Frequency & Severity, (2000:04 – 2004:04)
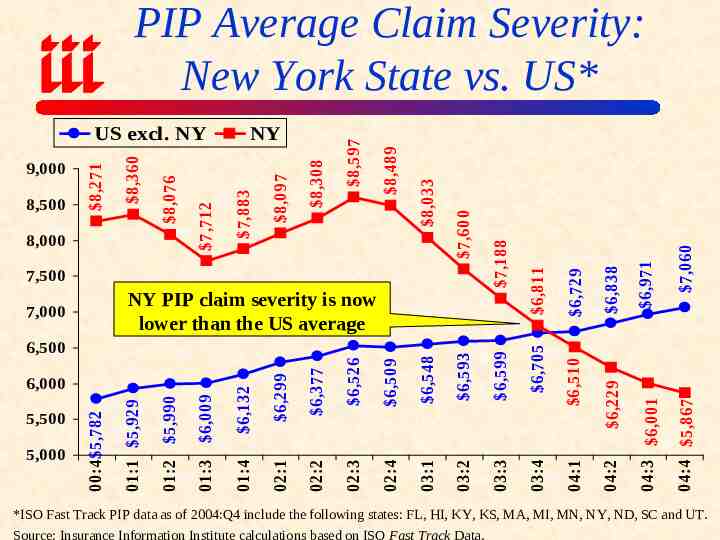
6,705 03:4 6,971 6,838 6,729 7,060 04:4 5,867 6,599 03:3 04:3 6,001 6,593 03:2 6,229 6,548 03:1 04:2 6,509 02:4 6,510 6,526 6,377 02:2 02:3 6,299 02:1 01:4 01:3 6,009 01:2 5,990 5,000 01:1 5,929 5,500 00:4 5,782 6,000 6,132 6,500 04:1 NY PIP claim severity is now lower than the US average 7,000 6,811 7,500 7,188 7,600 8,033 8,489 8,308 8,097 NY 7,883 8,000 7,712 8,076 8,500 8,360 9,000 8,271 US excl. NY 8,597 PIP Average Claim Severity: New York State vs. US* *ISO Fast Track PIP data as of 2004:Q4 include the following states: FL, HI, KY, KS, MA, MI, MN, NY, ND, SC and UT. Source: Insurance Information Institute calculations based on ISO Fast Track Data.
104.69 107.06 109.30 110.55 111.81 112.57 112.46 113.61 113.91 02:2 02:3 02:4 03:1 03:2 03:3 03:4 04:1 04:2 104.89 111.46 114.41 103.06 02:1 04:4 101.34 01:4 114.99 99.39 01:3 121.47 96.38 01:2 134.53 95.39 01:1 144.94 161.04 168.46 176.68 180.67 175.70 92.87 00:4 100 NY 04:3 120 60 172.74 171.18 Change Since 2000:4 NY: -44% US: 23% 140 80 US excl. NY 152.78 160 170.15 180 177.38 188.70 200 187.32 PIP Pure Premium: New York State vs. US* 40 20 0 *ISO Fast Track PIP data as of 2004:Q4 include the following states: FL, HI, KY, KS, MA, MI, MN, NY, ND, SC and UT. Source: Insurance Information Institute calculations based on ISO Fast Track Data.
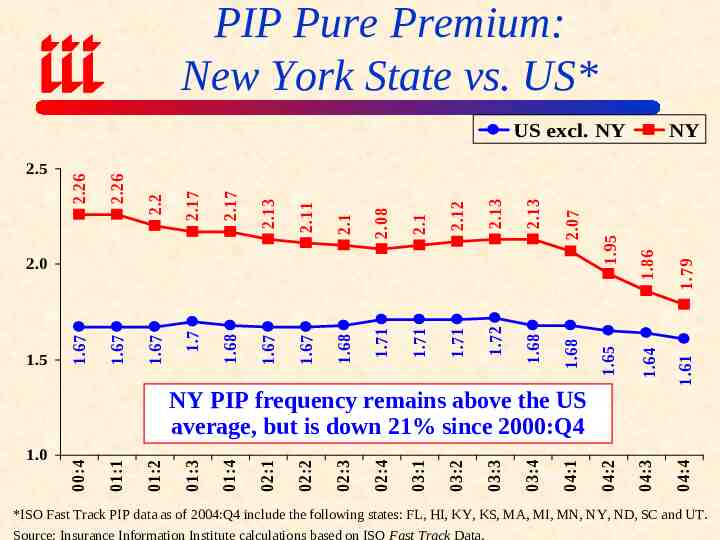
PIP Pure Premium: New York State vs. US* 1.79 1.61 04:4 1.86 1.64 04:3 1.95 1.65 1.68 1.68 1.72 1.71 1.71 1.71 1.68 1.67 1.67 1.68 1.7 1.5 1.67 2.0 NY 04:2 2.07 2.13 2.13 2.12 2.1 2.08 2.1 2.11 2.13 2.17 2.17 2.26 1.67 2.2 2.26 2.5 1.67 US excl. NY 04:1 03:4 03:3 03:2 03:1 02:4 02:3 02:2 02:1 01:4 01:3 01:2 01:1 1.0 00:4 NY PIP frequency remains above the US average, but is down 21% since 2000:Q4 *ISO Fast Track PIP data as of 2004:Q4 include the following states: FL, HI, KY, KS, MA, MI, MN, NY, ND, SC and UT. Source: Insurance Information Institute calculations based on ISO Fast Track Data.
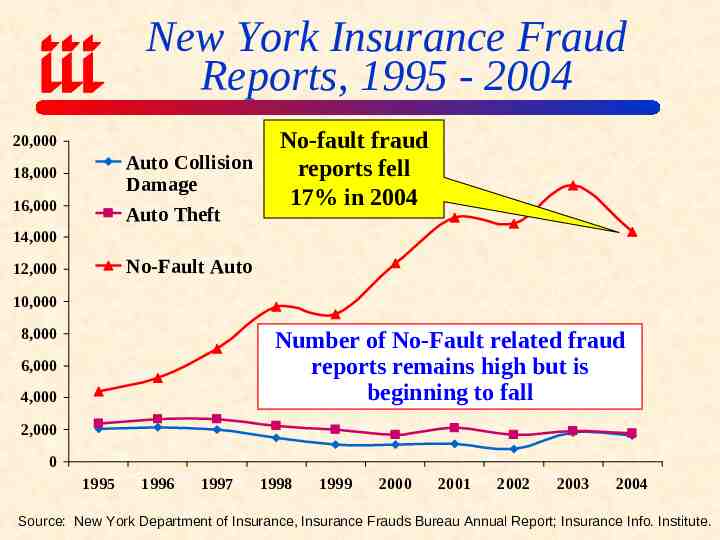
New York Insurance Fraud Reports, 1995 - 2004 20,000 Auto Collision Damage Auto Theft 18,000 16,000 No-fault fraud reports fell 17% in 2004 14,000 No-Fault Auto 12,000 10,000 8,000 Number of No-Fault related fraud reports remains high but is beginning to fall 6,000 4,000 2,000 0 1995 1996 1997 1998 1999 2000 2001 2002 2003 2004 Source: New York Department of Insurance, Insurance Frauds Bureau Annual Report; Insurance Info. Institute.
No-Fault Related Arrests by NY Insurance Fraud Bureau 200 182 180 160 140 107 120 88 100 80 60 50 40 20 0 2000 2001 2002 2003* *Data through August 2003. No-fault unit was merged with auto unit, separate no-fault arrest data no longer available. Source: New York Department of Insurance, Insurance Frauds Bureau Annual Report; Insurance Info. Institute.
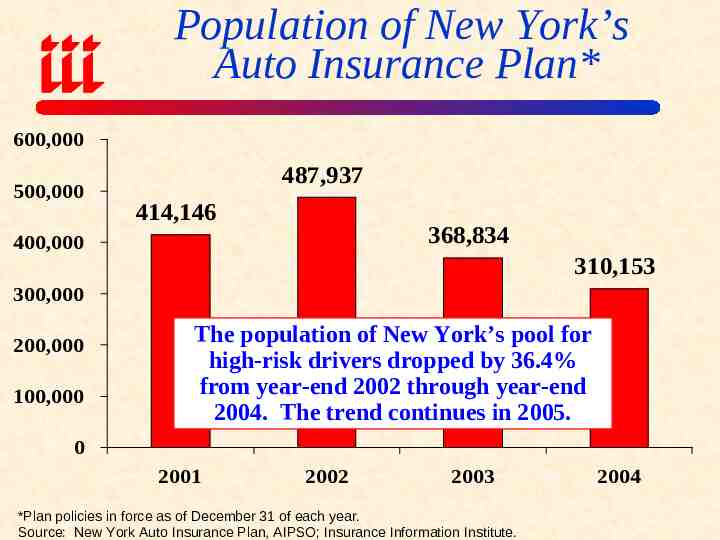
Population of New York’s Auto Insurance Plan* 600,000 500,000 487,937 414,146 368,834 400,000 310,153 300,000 200,000 100,000 The population of New York’s pool for high-risk drivers dropped by 36.4% from year-end 2002 through year-end 2004. The trend continues in 2005. 0 2001 2002 2003 *Plan policies in force as of December 31 of each year. Source: New York Auto Insurance Plan, AIPSO; Insurance Information Institute. 2004
A SCARY TRIP DOWN MEMORY LANE (Nightmare in Brooklyn)
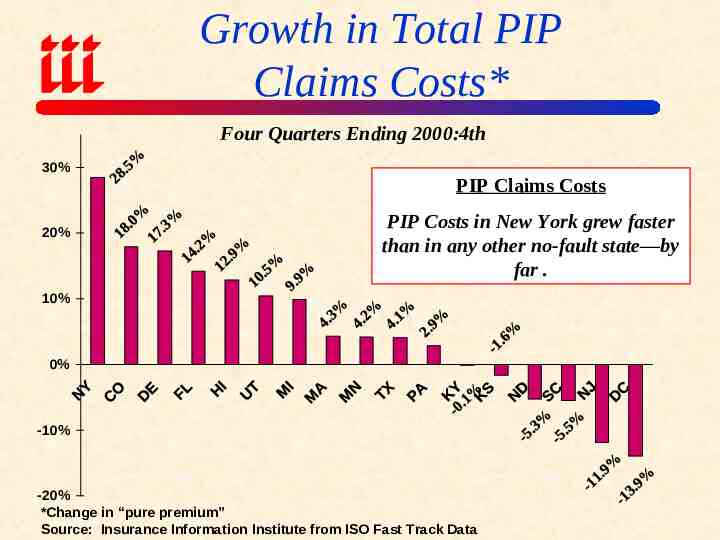
Growth in Total PIP Claims Costs* Four Quarters Ending 2000:4th 30% 20% PIP Claims Costs PIP Costs in New York grew faster than in any other no-fault state—by far . 10% 0% -10% -20% *Change in “pure premium” Source: Insurance Information Institute from ISO Fast Track Data
PIP Fraud and Abuse in New York State
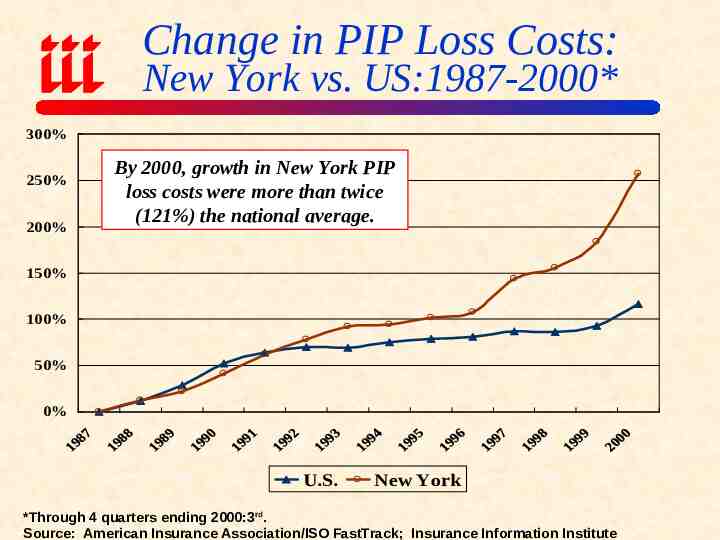
Change in PIP Loss Costs: New York vs. US:1987-2000* 300% 250% 200% By 2000, growth in New York PIP loss costs were more than twice (121%) the national average. 150% 100% 50% 0% U.S. New York *Through 4 quarters ending 2000:3rd. Source: American Insurance Association/ISO FastTrack; Insurance Information Institute
PIP Claim Severity 1995-2000: New York vs. United States 8,335 Average PIP Claim New York 6,700 6,064 5,675 4,862 3,976 1995 Other No-Fault States* 4,969 4,183 1996 4,352 1997 4,523 1998 Source: Fast Track Monitoring System, Fourth Quarter 2000 Report 4,699 1999 4,963 2000 * Excluding Michigan
Impact on Cost of Auto Insurance in New York State
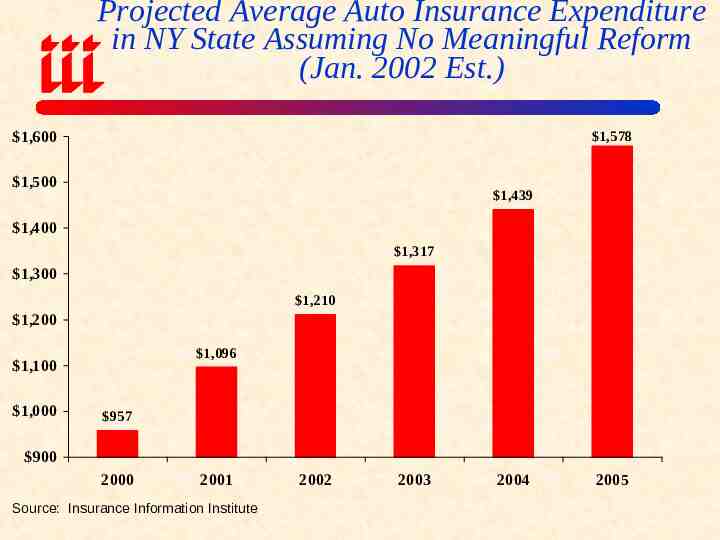
Projected Average Auto Insurance Expenditure in NY State Assuming No Meaningful Reform (Jan. 2002 Est.) 1,600 1,578 1,500 1,439 1,400 1,317 1,300 1,210 1,200 1,096 1,100 1,000 957 900 2000 2001 Source: Insurance Information Institute 2002 2003 2004 2005
Projected Average Cost of No-Fault Auto Insurance Fraud in NY State Assuming No Meaningful Reform (Jan. 2002 Est.) 400 Cost per Vehicle 321 300 242 200 177 124 100 81 46 9 0 1999 2000 2001 Source: Insurance Information Institute 2002 2003 2004 2005
What’s Left to be Done? NYIA: The Battle on Insurance Fraud is Far From Over Decertify Fraudulent Providers Still no way to decertify health care providers who commit no-fault fraud Increase Penalties for Runners Repeal Presbyterian Hospital Case Law should acknowledge that cases of suspected may require more time to investigate; Need exception to 30-day rule. Enact “File & Serve” Legislation Require filing of summons before serving summons. Allows large numbers of suits to be filed Restore Flex Rating Helps insurers deal with loss cost fluctuations, including those due to fraud and abuse Source: New York Insurance Association
Insurance Information Institute On-Line If you would like a copy of this presentation, please give me your business card with e-mail address