Introduction to Financial Statement Analysis P.V. Viswanath


52 Slides321.25 KB
Introduction to Financial Statement Analysis P.V. Viswanath
Themes Financial Statements have to be modified and/or understood appropriately to be useful to Financial Analysts. Accounting Value is not necessary Market Value – managers need market values for decision-making. Accounting Flows are not cashflows. Cashflows are relevant for valuation. Financial Ratios can be used to gauge the financial health of an institution. Financial Ratios can be used for strategic decision-making. Going beyond Financial Ratios P.V. Viswanath 2
Functions of Financial Statements They provide information to the owners and creditors of the firm about the company’s current status and past financial performance Financial statements provide a convenient way for owners and creditors to set performance targets and to impose restrictions on the managers of the firm. Financial statements provide convenient templates for financial planning. The main financial statements are the balance sheet, the income statement and the statement of cashflows. We start with the Balance Sheet. P.V. Viswanath 3
The Balance Sheet The balance sheet is a snapshot of the firm’s assets and liabilities at a given point in time Assets are listed in order of liquidity, i.e. ease of conversion to cash without significant loss of value Liabilities are listed in order of time to maturity. We will use the example of Pepsico’s financial statements from 2001-2002 and explain some common components of the balance sheet and income statement. P.V. Viswanath 4
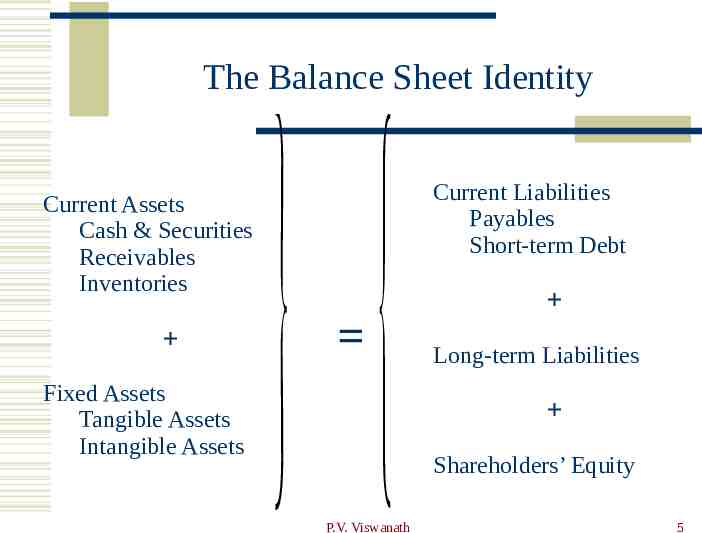
The Balance Sheet Identity Current Assets Cash & Securities Receivables Inventories Fixed Assets Tangible Assets Intangible Assets P.V. Viswanath Current Liabilities Payables Short-term Debt Long-term Liabilities Shareholders’ Equity 5
Poll: Assets or Liabilities Which number is greater for most firms? The Total Assets number has to be greater – assets are what allows firms to accomplish what they need to do. Total Liabilities are greater – it is well known that most startups go out of business, this is because they end up owing more than they own. Total Assets and Total Liabilities both have an equal chance of being greater. Total Assets and Total Liabilities are also equal. P.V. Viswanath 6
Assets Assets are divided into current assets and long-term assets. Current assets are: Cash and marketable securities Accounts receivable Inventories Other current assets, such as prepaid expenses Long-term assets include net property, plant and equipment (net PP&E). This consists of the original cost of PP&E reduced each year by an amount called depreciation that is intended to account for wear-and-tear and obsolescence. P.V. Viswanath 7
Assets When a firm acquires another firm, it will acquire a set of assets that must be listed on its balance sheet. Often it will pay more for these assets than their book value on the acquired firm’s balance sheet. The difference is listed as goodwill. Trade-marks, patents and other such assets, along with goodwill are called intangible assets. If their value decreases over time, they will be reduced by an amortization charge. Amortization, like depreciation is not a cash expense. P.V. Viswanath 8
Poll: Goodwill Goodwill on a GAAP balance sheet: An asset quantifying the established reputation of a firm. A catch-all category that is only tenuously related to a firm’s reputation. An asset quantifying the cooperation between employees of a firm. P.V. Viswanath 9
Liabilities Liabilities are divided into current and long-term liabilities. Liabilities that will be satisfied in one year are known as current, and include: Accounts payable, Notes payable, short-term debt and all repayments of debt that will occur within the year. Items such as salary or taxes that are owed but have not yet been paid. The difference between current assets and current liabilities is known as (net) working capital. P.V. Viswanath 10
Long-term liabilities Long-term liabilities represent obligations of the firm to make payouts over more than a year. For example: Long-term debt is any loan or debt obligation with a maturity of more than one year. Capital leases are long-term lease contracts that obligate the firm to make regular payments in exchange for the use of an asset. We now discuss deferred tax liabilities and deferred tax assets – two categories that are purely accounting entities. P.V. Viswanath 11
Deferred Tax Liabilities Deferred taxes are taxes that are owed but not yet paid. Firms keep two sets of books – one for financial reporting and one for tax purposes. Deferred tax liabilities arise when the firm’s financial (accounting) income exceeds its income for tax purposes. If a firm depreciates assets faster for tax purposes than for reporting purposes, its tax paid will be less than tax due according to reported income. Hence it will look as if the firm has not paid taxes that it owes. Over time, the discrepancy will disappear and the tax due will be “paid.” Hence deferred tax is recorded as a liability. P.V. Viswanath 12
Deferred Tax Liabilities Suppose there is a depreciable asset worth 500 with a life of two years. Reported depreciation (straight line) is 250 in each of two years. Depreciation for tax purposes is accelerated -- 300 in year 1 and 200 in year 2. If the tax rate is 20%, actual tax paid (based on the higher depreciation) will be 20% of 50 or 10 less. Hence this will create a tax liability, i.e. an obligation to pay the IRS 10 in the future. However, in the next period, reported depreciation is 250, while actual depreciation for tax purposes is 200; then the actual tax paid (based on the lower depreciation of 200 will be 20%(50) or 10 more than the tax required on the reported income. This will reduce the tax liability to zero. P.V. Viswanath 13
Deferred Tax Assets In principle, there could be deferred tax assets, as well. This occurs when reported accounting income is less than taxable income; i.e. when tax actually paid (based on taxable income) is greater than the tax liability (based on reported income). For example, when a product is sold with a warranty, warranty expense is estimated for the period the products are sold even though the actual cost isn’t incurred until later periods. This causes reported income to be lower. However, tax laws recognize a warranty expense only when the payment is actually made. Hence actual tax paid can be higher if actual warranty payments in a given period are lower. P.V. Viswanath 14
Deferred Tax Assets Suppose actual warranty payouts in earlier periods are lower than the warranty expense. Since only actual payouts can be deducted, the taxable income will be higher. But the higher accounting warranty expense will make the accounting income lower and hence the required accounting tax payment lower. This actual “excessively” high payment will thus generate a deferred tax asset. If the warranty expense is correctly estimated on average, the lower early payouts will be balanced by higher warranty payments in later periods, will generate tax benefits. These are recognized now, as a (deferred tax) asset, as it were. P.V. Viswanath 15
Stockholder’s Equity The sum of current liabilities and long-term liabilities is total liabilities. The difference between the firm’s assets and its liabilities is Stockholders’ Equity or the book value of equity. This number often does not provide us with an accurate assessment of the firm’s equity because book values are based on historical quantities and not on market values. The market price of a share times shares outstanding is called market capitalization; this reflects what investors expect the firms assets to produce in the future that can be distributed to shareholders. P.V. Viswanath 16
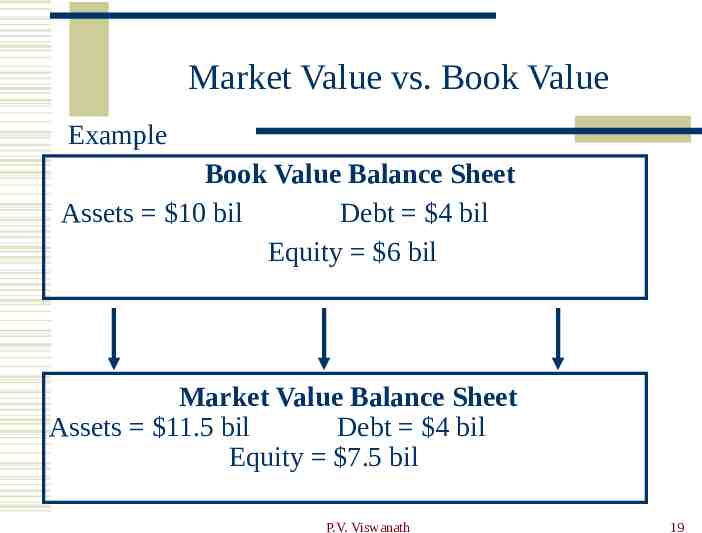
Market Value vs. Book Value Example According to Generally Accepted Accounting Principles (GAAP), your firm has equity worth 6 billion, debt worth 4 billion, assets worth 10 billion. The market values your firm’s 100 million shares at 75 per share and the debt at 4 billion. Q: What is the market value of your assets? A: Since (Assets Liabilities Equity), your assets must have a market value of 11.5 billion. In this example, the market value of debt is the same as the book value of debt, but this need not always be true. P.V. Viswanath 17
Poll: Grammatical correctness Which one of these statements is correctly expressed? Balance Sheet for the Pepsico Corporation for the year 2019 Balance Sheet for the Pepsico Corporation as of Dec. 31, 2019 Both P.V. Viswanath 18
Market Value vs. Book Value Example Book Value Balance Sheet Assets 10 bil Debt 4 bil Equity 6 bil Market Value Balance Sheet Assets 11.5 bil Debt 4 bil Equity 7.5 bil P.V. Viswanath 19
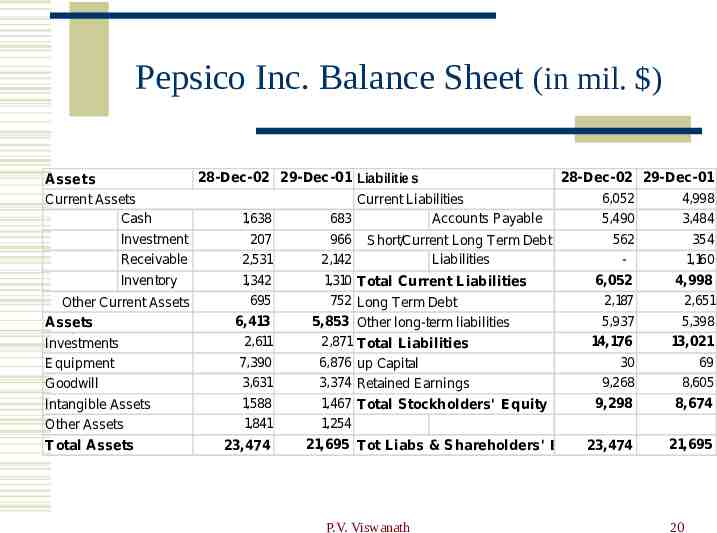
Pepsico Inc. Balance Sheet (in mil. ) 28-Dec-02 29-Dec-01 Liabilities 28-Dec-02 29-Dec-01 Assets 6,052 4,998 Current Assets Current Liabilities Cash And Cash 1,638 683 Accounts P ayable 5,490 3,484 Short T erm Investment 207 966 Short/Current 562 354 Long T erm Debt Net Other Current Receivable 2,531 2,142 Liabilities 1,160 Inventory 1,342 1,310 T otal Current Liabilities 6,052 4,998 695 752 Long T erm Debt 2,187 2,651 Other Current Assets T otal Current 6,413 5,853 Other long-term liabilities 5,937 5,398 Assets Long T erm 2,611 2,871 T 14,176 13,021 Investments otal Liabilities P roperty P lant and Common Stock & Other P aid7,390 6,876 up Capital 30 69 Equipment 3,631 3,374 Retained Earnings 9,268 8,605 Goodwill 1,588 1,467 T otal Stockholders' E quity 9,298 8,674 Intangible Assets 1,841 1,254 Other Assets 21,695 T ot Liabs & Shareholders' E quity 21,695 T otal Assets 23,474 23,474 P.V. Viswanath 20
Operating and Financial Until now, we talked quantities on the balance sheet being distinguished as assets and liabilities or short-term and long-term. Let’s think of balance sheet quantities being Operating or Financial P.V. Viswanath 21
Poll: Operating Assets Which of the following is not an operating asset? Inventory Accounts Receivable Property Plant and Equipment Marketable Securities P.V. Viswanath 22
Income Statement The income statement is like a video of the firm’s operations for a specified period of time. You report revenues first and then deduct any expenses for the period. Matching principle – GAAP requires the income statement to show revenue when it accrues and match the expenses required to generate the revenue. P.V. Viswanath 23
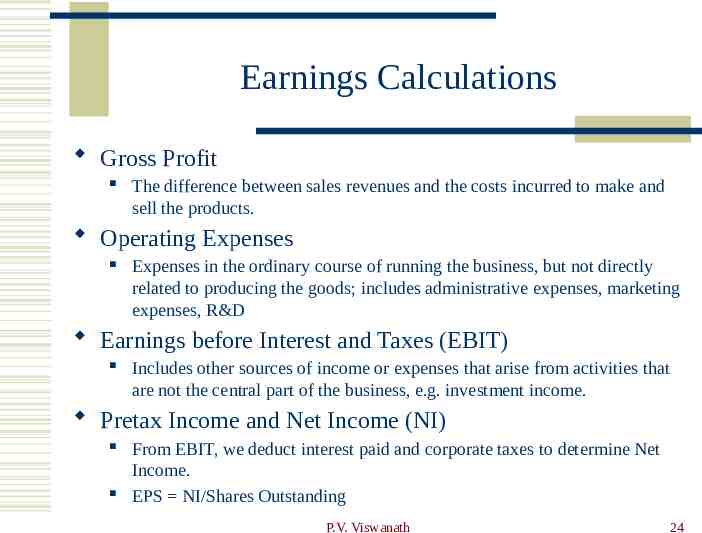
Earnings Calculations Gross Profit The difference between sales revenues and the costs incurred to make and sell the products. Operating Expenses Expenses in the ordinary course of running the business, but not directly related to producing the goods; includes administrative expenses, marketing expenses, R&D Earnings before Interest and Taxes (EBIT) Includes other sources of income or expenses that arise from activities that are not the central part of the business, e.g. investment income. Pretax Income and Net Income (NI) From EBIT, we deduct interest paid and corporate taxes to determine Net Income. EPS NI/Shares Outstanding P.V. Viswanath 24
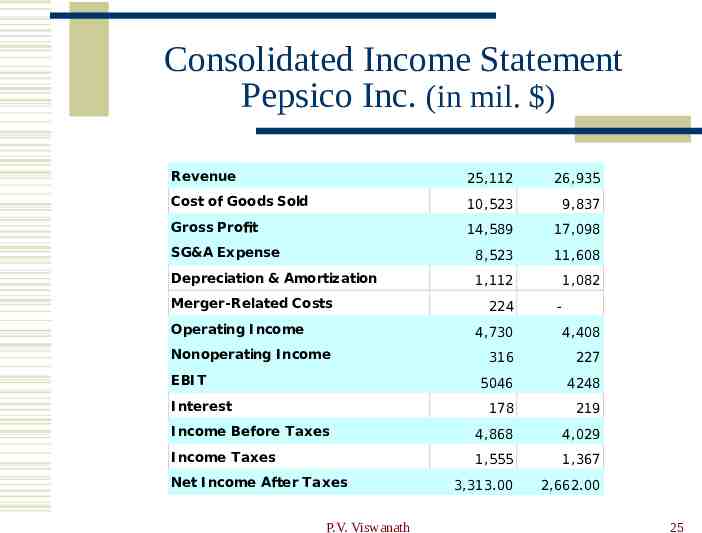
Consolidated Income Statement Pepsico Inc. (in mil. ) Revenue 25,112 26,935 Cost of Goods Sold 10,523 9,837 Gross Profit 14,589 17,098 SG&A Expense 8,523 11,608 Depreciation & Amortization 1,112 1,082 Merger-Related Costs Operating I ncome 224 - 4,730 4,408 316 227 5046 4248 178 219 I ncome Before Taxes 4,868 4,029 I ncome Taxes 1,555 1,367 3,313.00 2,662.00 Nonoperating I ncome EBI T I nterest Net I ncome After Taxes P.V. Viswanath 25
Accounting vs Economic Measures of Income The return to a stockholder of investing in a stock is simply the rate of return on his investment: Ending Price of Share - Beginning Price Cash Dividend r Beginning Price of Share Accountants often measure corporate performance using the return on equity (ROE): ROE Net Income Shareholders' Equity A big difference between the two is that the ROE does not incorporate the impact on the share price of future expected superior (or inferior) returns So if we want to evaluate return generated by activities in a particular period, an accounting measure like ROE or ROA is more appropriate than holding period return. P.V. Viswanath 26
Ratio Analysis Ratios also allow for better comparison through time or between companies As we look at each ratio, ask yourself what the ratio is trying to measure and why is that information important. Keep in mind also the difference between flow numbers (over a period of time) and stock numbers (at a specific point in time). Ratios are used both internally and externally P.V. Viswanath 27
Categories of Financial Ratios Profitability ratios Used to measure the firm’s return on its investments Liquidity ratios Short-term solvency or how easily the firm can lay its hands on cash. Financial leverage ratios Show long-term solvency; how heavily the firm is in debt. Efficiency or turnover ratios Indicate how productively the firm is using its assets Market value ratios P.V. Viswanath 28
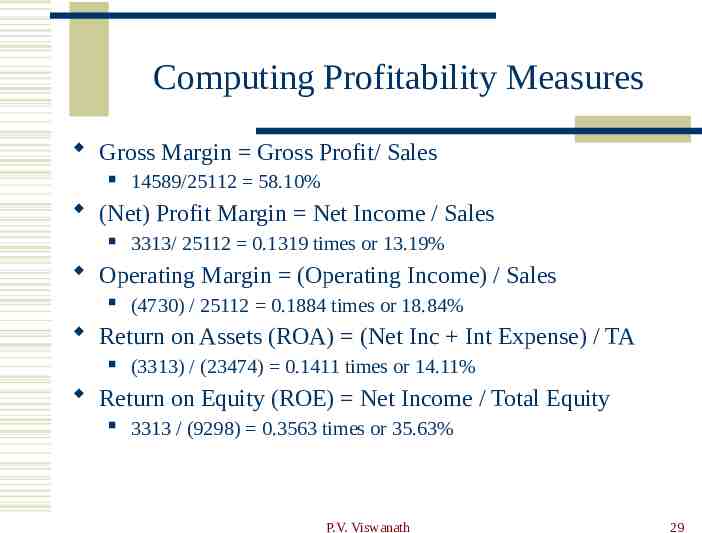
Computing Profitability Measures Gross Margin Gross Profit/ Sales 14589/25112 58.10% (Net) Profit Margin Net Income / Sales 3313/ 25112 0.1319 times or 13.19% Operating Margin (Operating Income) / Sales (4730) / 25112 0.1884 times or 18.84% Return on Assets (ROA) (Net Inc Int Expense) / TA (3313) / (23474) 0.1411 times or 14.11% Return on Equity (ROE) Net Income / Total Equity 3313 / (9298) 0.3563 times or 35.63% P.V. Viswanath 29
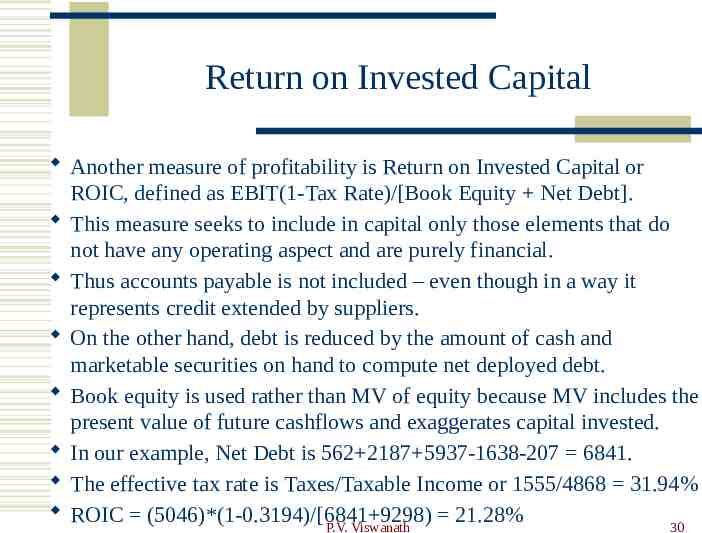
Return on Invested Capital Another measure of profitability is Return on Invested Capital or ROIC, defined as EBIT(1-Tax Rate)/[Book Equity Net Debt]. This measure seeks to include in capital only those elements that do not have any operating aspect and are purely financial. Thus accounts payable is not included – even though in a way it represents credit extended by suppliers. On the other hand, debt is reduced by the amount of cash and marketable securities on hand to compute net deployed debt. Book equity is used rather than MV of equity because MV includes the present value of future cashflows and exaggerates capital invested. In our example, Net Debt is 562 2187 5937-1638-207 6841. The effective tax rate is Taxes/Taxable Income or 1555/4868 31.94% ROIC (5046)*(1-0.3194)/[6841 9298) 21.28% P.V. Viswanath 30
Computing Liquidity Ratios Current Ratio CA / CL 6413 /6052 1.06 times Quick Ratio (CA – Inventory) / CL (6413 – 1342) / 6052 0.838 times Cash Ratio Cash / CL 1,638 / 6,052 .276 times Net Working Capital to TA Ratio NWC/TA (6413-6052)/ 23474 0.154 P.V. Viswanath 31
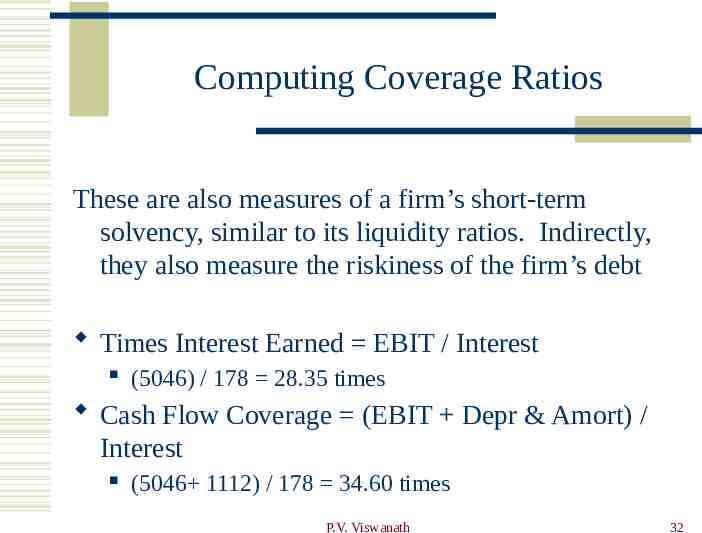
Computing Coverage Ratios These are also measures of a firm’s short-term solvency, similar to its liquidity ratios. Indirectly, they also measure the riskiness of the firm’s debt Times Interest Earned EBIT / Interest (5046) / 178 28.35 times Cash Flow Coverage (EBIT Depr & Amort) / Interest (5046 1112) / 178 34.60 times P.V. Viswanath 32
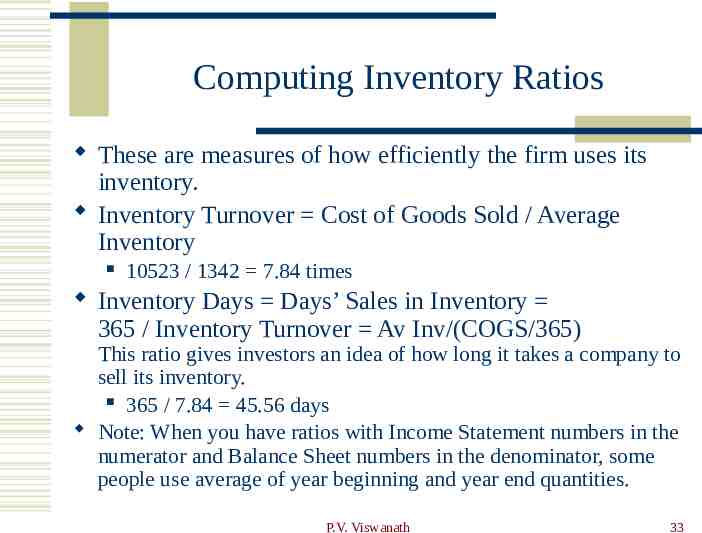
Computing Inventory Ratios These are measures of how efficiently the firm uses its inventory. Inventory Turnover Cost of Goods Sold / Average Inventory 10523 / 1342 7.84 times Inventory Days Days’ Sales in Inventory 365 / Inventory Turnover Av Inv/(COGS/365) This ratio gives investors an idea of how long it takes a company to sell its inventory. 365 / 7.84 45.56 days Note: When you have ratios with Income Statement numbers in the numerator and Balance Sheet numbers in the denominator, some people use average of year beginning and year end quantities. P.V. Viswanath 33
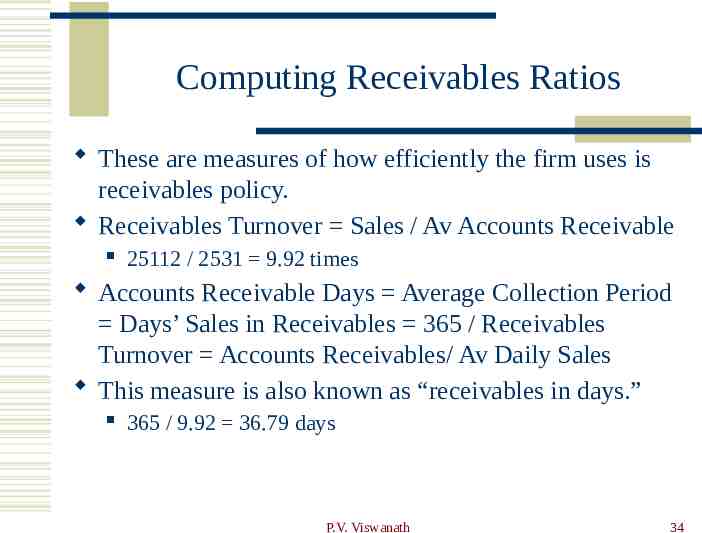
Computing Receivables Ratios These are measures of how efficiently the firm uses is receivables policy. Receivables Turnover Sales / Av Accounts Receivable 25112 / 2531 9.92 times Accounts Receivable Days Average Collection Period Days’ Sales in Receivables 365 / Receivables Turnover Accounts Receivables/ Av Daily Sales This measure is also known as “receivables in days.” 365 / 9.92 36.79 days P.V. Viswanath 34
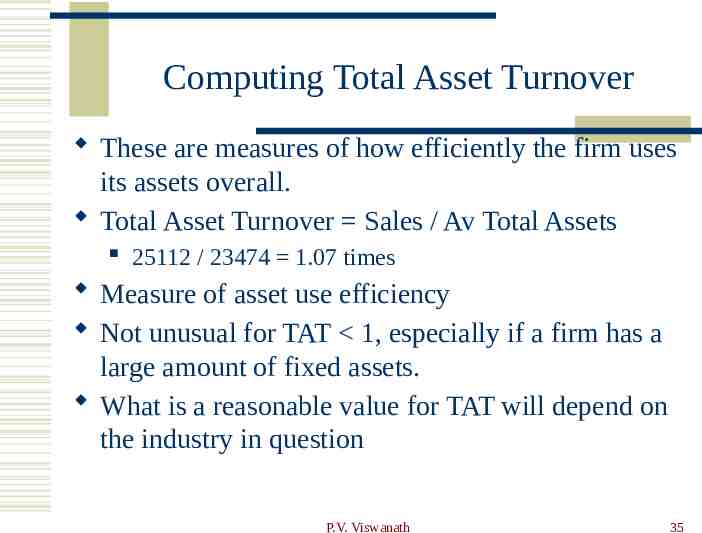
Computing Total Asset Turnover These are measures of how efficiently the firm uses its assets overall. Total Asset Turnover Sales / Av Total Assets 25112 / 23474 1.07 times Measure of asset use efficiency Not unusual for TAT 1, especially if a firm has a large amount of fixed assets. What is a reasonable value for TAT will depend on the industry in question P.V. Viswanath 35
Poll: Profitability Which is the most important measure of profitability? Gross Profit Margin Net Profit Margin Asset Turnover P.V. Viswanath 36
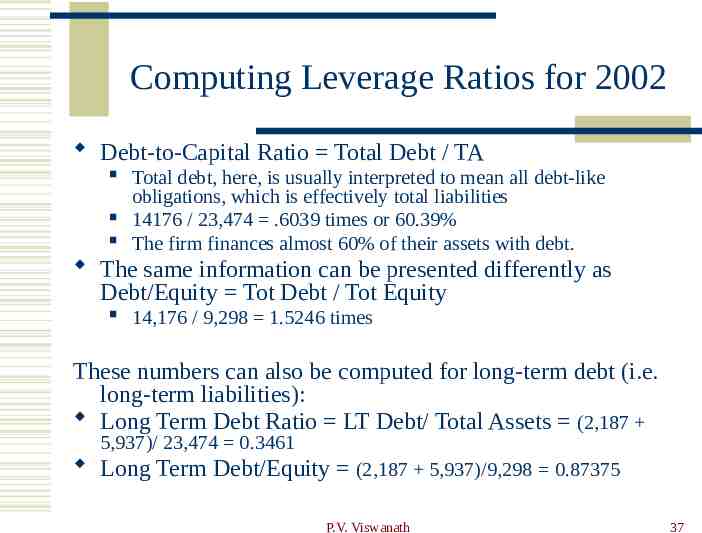
Computing Leverage Ratios for 2002 Debt-to-Capital Ratio Total Debt / TA Total debt, here, is usually interpreted to mean all debt-like obligations, which is effectively total liabilities 14176 / 23,474 .6039 times or 60.39% The firm finances almost 60% of their assets with debt. The same information can be presented differently as Debt/Equity Tot Debt / Tot Equity 14,176 / 9,298 1.5246 times These numbers can also be computed for long-term debt (i.e. long-term liabilities): Long Term Debt Ratio LT Debt/ Total Assets (2,187 5,937)/ 23,474 0.3461 Long Term Debt/Equity (2,187 5,937)/9,298 0.87375 P.V. Viswanath 37
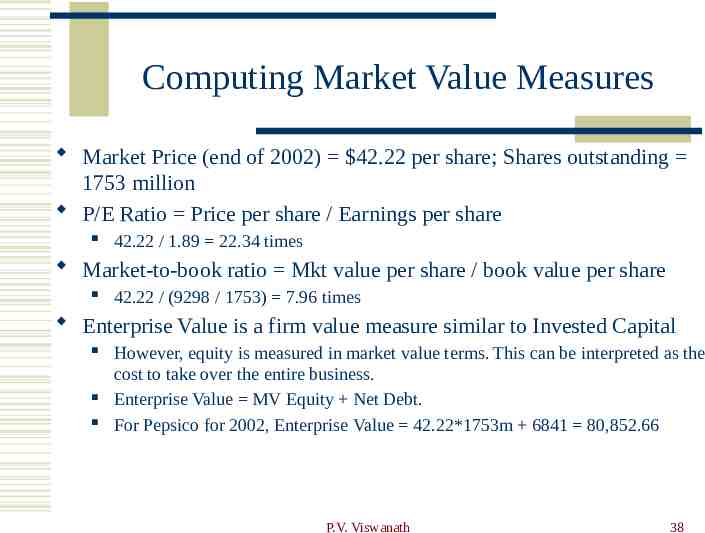
Computing Market Value Measures Market Price (end of 2002) 42.22 per share; Shares outstanding 1753 million P/E Ratio Price per share / Earnings per share 42.22 / 1.89 22.34 times Market-to-book ratio Mkt value per share / book value per share 42.22 / (9298 / 1753) 7.96 times Enterprise Value is a firm value measure similar to Invested Capital However, equity is measured in market value terms. This can be interpreted as the cost to take over the entire business. Enterprise Value MV Equity Net Debt. For Pepsico for 2002, Enterprise Value 42.22*1753m 6841 80,852.66 P.V. Viswanath 38
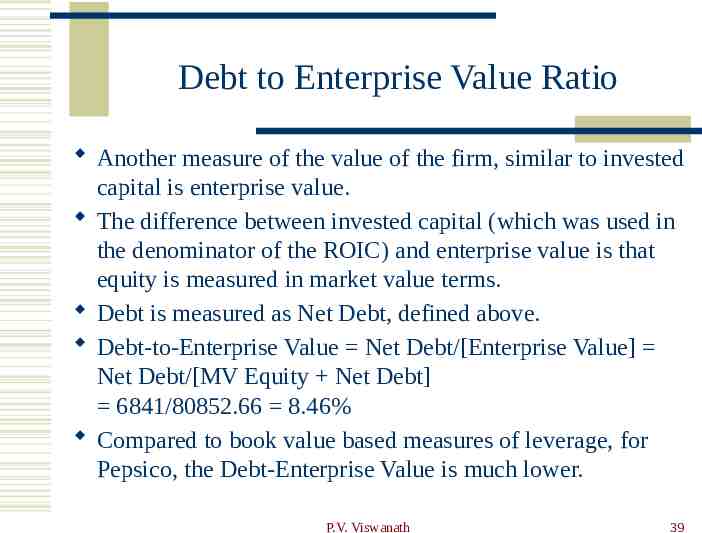
Debt to Enterprise Value Ratio Another measure of the value of the firm, similar to invested capital is enterprise value. The difference between invested capital (which was used in the denominator of the ROIC) and enterprise value is that equity is measured in market value terms. Debt is measured as Net Debt, defined above. Debt-to-Enterprise Value Net Debt/[Enterprise Value] Net Debt/[MV Equity Net Debt] 6841/80852.66 8.46% Compared to book value based measures of leverage, for Pepsico, the Debt-Enterprise Value is much lower. P.V. Viswanath 39
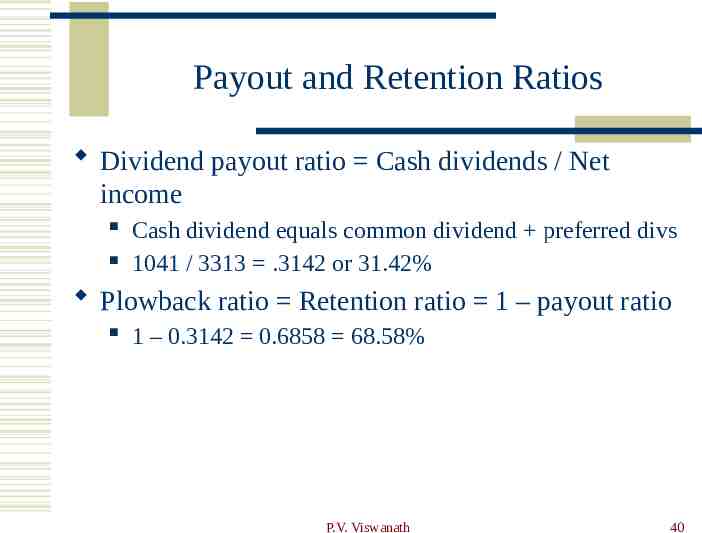
Payout and Retention Ratios Dividend payout ratio Cash dividends / Net income Cash dividend equals common dividend preferred divs 1041 / 3313 .3142 or 31.42% Plowback ratio Retention ratio 1 – payout ratio 1 – 0.3142 0.6858 68.58% P.V. Viswanath 40
Benchmarking Ratios are not very helpful by themselves; they need to be compared to something Time-Trend Analysis Used to see how the firm’s performance is changing through time Internal and external uses Peer Group Analysis Compare to similar companies or within industries SIC and NAICS codes P.V. Viswanath 41
Standardized Financial Statements Common-Size Balance Sheets Compute all accounts as a percent of total assets Common-Size Income Statements Compute all line items as a percent of sales Standardized statements make it easier to compare financial information, particularly as the company grows They are also useful for comparing companies of different sizes, particularly within the same industry P.V. Viswanath 42
Statement of Cashflows A firm’s cashflows can be quite different from its net income. For example: The income statement does not recognize capital expenditures as expenses in the year that the capital goods are paid for. Those expenses are spread over time as a deduction for depreciation. The income statement recognizes revenues and expenses when sales are made, even though the money may not have been collected (revenues) or paid out (expenses). P.V. Viswanath 43
The Statement of Cashflows The statement of cashflows shows the firm’s cash inflows and outflows from Operations Investments and Financing The form of this statement is determined by accounting standards. P.V. Viswanath 44
Statement of Cash Flows: Operating Activities Operating activities are earnings-related activities. Generally these relate to Income Statement activities, and items included in working capital. Included are: Sales and expenses necessary to obtain sales Related operating activities, such as extending credit to customers investing in inventories obtaining credit from suppliers payment of taxes insurance payments Other activities that don't easily fit into the other two categories, such as settlements in lawsuits. P.V. Viswanath 45
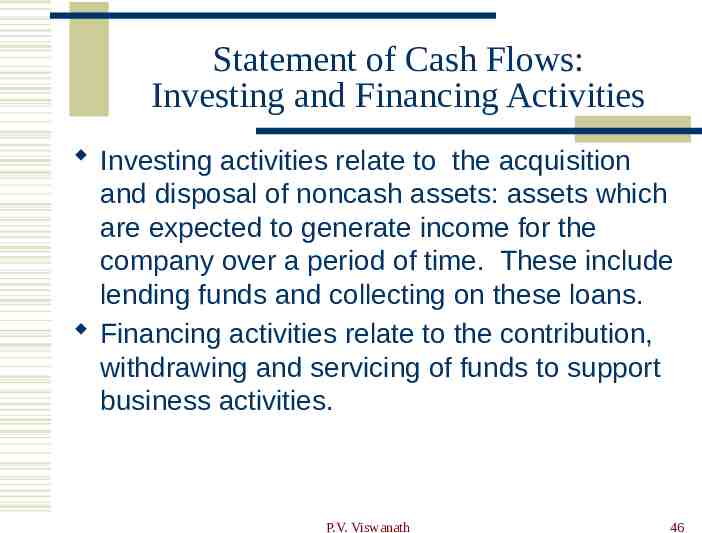
Statement of Cash Flows: Investing and Financing Activities Investing activities relate to the acquisition and disposal of noncash assets: assets which are expected to generate income for the company over a period of time. These include lending funds and collecting on these loans. Financing activities relate to the contribution, withdrawing and servicing of funds to support business activities. P.V. Viswanath 46
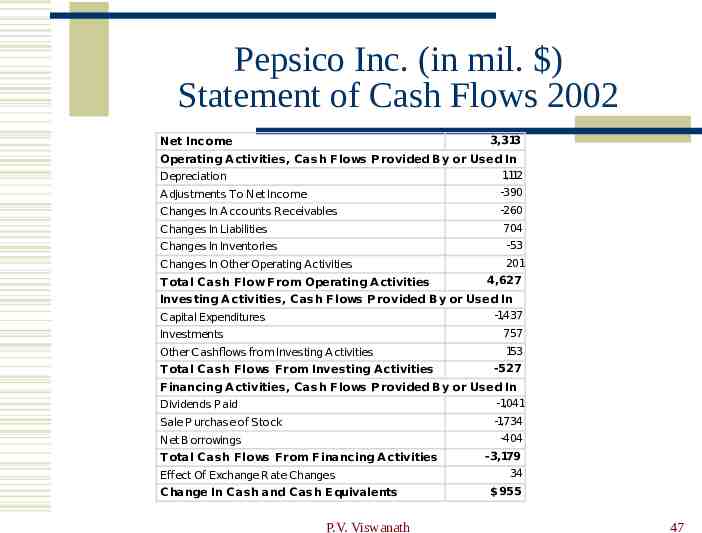
Pepsico Inc. (in mil. ) Statement of Cash Flows 2002 3,313 Net Income Operating A ctivities, C ash Flows P rovided B y or Used In 1,112 Depreciation A djustments To Net Income -390 Changes In A ccounts Receivables -260 Changes In Liabilities 704 Changes In Inventories -53 Changes In Other Operating Activities 201 T otal C ash Flow From Operating A ctivities 4,627 Investing A ctivities, C ash Flows P rovided B y or Used In -1,437 Capital Expenditures Investments 757 Other Cashflows from Investing A ctivities 153 T otal C ash Flows From Investing A ctivities -527 F inancing A ctivities, C ash Flows P rovided B y or Used In -1,041 Dividends P aid -1,734 Sale P urchase of Stock -404 Net Borrowings T otal C ash Flows From Financing A ctivities Effect Of Exchange Rate Changes C hange In C ash and C ash E quivalents P.V. Viswanath -3,179 34 955 47
Notes to Financial Statements The Notes to the Financial Statements are frequently very useful in assessing the financial health of the firm. They often contain: An explanation of accounting methods used Straight-line versus accelerated depreciation LIFO vs FIFO Restatement of results from prior years using the new standards Greater details regarding certain assets and liabilities Conditions and expiration dates of long- and short-term debt, leases, etc. P.V. Viswanath 48
Notes to Financial Statements Information regarding the equity structure of the firm Documentation of changes in operations Conditions attached to the ownership of shares; these can be particularly useful to assess the firm’s vulnerability to takeovers. Acquisitions and Divestitures and their impact Off-balance sheet items Forward contracts, swaps, options and other derivative contracts, which do not appear in the balance sheet, but which can affect a firm greatly. A lot of Enron’s problems had to do with such offbalance sheet items. P.V. Viswanath 49
The Du Pont Model Financial statements and the financial ratios that are derived from the quantities in financial statements can be used as direct measures of firm performance. But they can be used for much more. We now look briefly at a model that uses accounting numbers, but in a way that can be used to analyze and optimize firm operations. This is the Du Pont model, which was developed by the DuPont Corporation to analyze internal efficiency. But we will see who this can be used to do a lot more! P.V. Viswanath 50
The Du Pont Identity ROE NI / TE ROE (NI/Sales)*(Sales/TA)*(TA/TE) Net Profit Margin*Asset Turnover*Equity Multiplier Net Profit margin is primarily a measure of the firm’s pricing power, derived from its branding and marketing strategies. Total asset turnover is a measure of the firm’s asset use efficiency – how well it manages its assets. Equity multiplier is a measure of the firm’s financial leverage. A firm could have a high volume/low margin strategy, which would be reflected in high asset turnover but low profit margins or the reverse. The DuPont identity is a convenient way of separating out the different sources of the firm’s profitability. P.V. Viswanath 51
Determinants of Growth The growth rate of earnings of a firm is equal to the ROE x retention rate. But how does this relate to firm operations? The Dupont model tells us that the ROE is determined by: Profit margin – operating efficiency Total asset turnover – asset use efficiency Financial leverage – choice of optimal debt ratio The retention rate is determined by dividend policy – the choice of how much to pay to shareholders versus reinvesting in the firm. These four elements determine earnings growth rate. P.V. Viswanath 52