Guoquing Xu, Atanas Rountev Ohio State University Oct 9th,
24 Slides4.03 MB
Guoquing Xu, Atanas Rountev Ohio State University Oct 9th, 2008 Presented by Eun Jung Park
Example of memory leak/dangling pointer in C/C int int *pi; *pi; void void foo() foo() {{ pi pi (int*) (int*) malloc(8*sizeof(int)); malloc(8*sizeof(int)); // // oops, oops, memory memory leak leak of of 44 ints ints // // use use pi pi free(pi); free(pi); // // foo() foo() is is done done with with pi pi }} void void main() main() {{ pi pi (int*) (int*) malloc(4*sizeof(int)); malloc(4*sizeof(int)); foo(); foo(); pi[0] pi[0] 10; 10; // // oops, oops, pi pi is is now now aa dangling dangling pointer pointer }} How about in Java? GC (Garbage Collector) will handle this! Then what is memory leak problem in Java? Above example is from http://www.ibm.com/developerworks/rational/library/05/0816 GuptaPalanki/index.html
What is Java Memory Leak? Object references that are no longer needed are unnecessarily maintained. They will not disappeared by GC. public public void void slowlyLeakingVector(int slowlyLeakingVector(int iter, iter, int int count) count) {{ for for (int (int i 0; i 0; i iter; i iter; i ) i ) {{ for for (int (int n 0; n 0; n count; n count; n ) n ) {{ myVector.add(Integer.toString(n i)); myVector.add(Integer.toString(n i)); }} for for (int (int n count-1; n count-1; n 0; n 0; n--) n--) {{ // // Oops, Oops, it it should should be be n 0 n 0 myVector.removeElementAt(n); myVector.removeElementAt(n); }} }} }} Why Java Memory Leak is bad? It can degrade the performance. It can eventually cause running out of memory and crash. It is difficult to find. Above example is from http://www.ibm.com/developerworks/rational/library/05/0816 GuptaPalanki/index.html
Static method using compiler or code analysis Not precise: Usually they cannot precisely identify these unnecessary references. Not scalable: It is not good to use for large application. Dynamic method using fine-grained runtime information about individual objects with single information - memory contribution or staleness contribution. Not precise: They use from-symptom-to-cause approach and it can be difficult to locate the source of the leak and cause the imprecise leak reports. (possible false positive) Hard to interpret and not sufficient for programmers: The output is too complex to interpret and lack of precision. Also the output is not enough to locate a bug for programmers.
Dynamic method with container-based heap-tracking Instead of using from-symptom-to-cause Only track containers to directly identify the source of the leak. Instead of using single information Compute heuristic confidence value for each container based on the combination of Overall memory consumption Each container’s memory consumption Each container’s staleness contribution What is definition of container? An abstract data type (ADT) with a set of data elements and three basic operations ADD, GET, and REMOVE. (e.g., hash table, graphical element) Why container is suspicious? Container causes many memory leaks in Java!
Contribution 1: Computing a Confidence Value Contribution 2: Java Memory Leak Detection Contribution 3: Implementation Contribution 4: Empirical Evaluation
Define Define Memory Memory Leak Leak Symptom Symptom Define Define Memory Memory Leak Leak Free Free Choose Choose Non Non Memory-Leak-Free Memory-Leak-Free Containers Containers Calculate Calculate Memory Memory Contribution Contribution Calculate Calculate Staleness Staleness Contribution Contribution Put Put them them together! together! Calculate Calculate Leaking Leaking Confidence Confidence
A program written in garbage-collected language has a memory leak symptom within [ s , e ] if gc i (1) Memory consumption at the moment immediately after gc-events gc in the region,ms mi me gc gc gc (2) There exists a subsequencesss ( 1 , 2 ,., n of) gc-events, memory consumption at each gc-events keeps growing How to define s and e ? e by offline: Ending of the program or the out of memory error. e by online: User-defined. gc events will be a check-points. s : Choose the smallest user-defined ratio to get the longest region and more precise analysis. This helps to identify the appropriate time region to analyze
A container is memory-leak-free if (1) at the end of leak region, the number of element is 0 (2) all elements added were removed and garbage collected within the leak region. This means that # of ADD # of REMOVE . Why we this need definition? Containers that are not memory-leak-free will "possibly" contribute to the memory leak symptom and considered for further evaluation. We choose container that is not memory-leak-free and we are ready to go to next step!
MC MC Memory time graph is used to capture a container's memory footprint. x-axis: the relative time of Memory consumption of all reachable program execution at i i objects from container x-axis y-axis: memory x-axis the ,relative , y-axis y-axis of memory consumption Total e of a container i consumption at amount of a container at at i Staring point: 0/ e, where 0 max( s , allocation time of container) Ending point: 1/ e, where 1 min( e, deallocation time of container) Container’s memory contribution is defined as the area covered by the memory consumption curve in the graph.
MC MC Staleness: the time since the object's last use. 1 and 2 How calculate Staleness? time diff between where, 2 : the moment that element was removed from a container. 1 : the moment that element was added into a container or retrieved from a container. 1 and 2 . Condition: no retrieval of element between If 1 s ? If 2 s ? If an element is never removed from a container? How calculate Staleness contribution? When we have o1.on element n staleness (oi ) / n in a container, i 1 e s SC SC
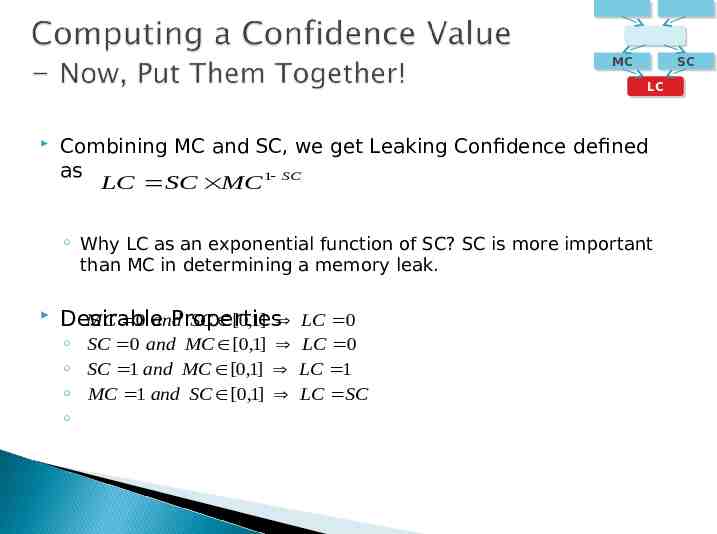
MC MC SC SC LC LC Combining MC and SC, we get Leaking Confidence defined as LC SC MC 1 SC Why LC as an exponential function of SC? SC is more important than MC in determining a memory leak. Desirable Properties MC 0 and SC [0,1] LC 0 SC 0 and MC [0,1] LC 0 SC 1 and MC [0,1] LC 1 MC 1 and SC [0,1] LC SC
Non Non Leak-free Leak-free Containers Containers Container Container Modeling Modeling Code Code Instrumentation Instrumentation Leak Leak sympto sympto m m Leak Leak free free MC MC SC SC LC LC Instrumented Instrumented code code with with glue glue class class Profiling Profiling Data Data Analysis Analysis Leaking Leaking Call Call Sites Sites Information Information of of Potential Potential leaking leaking containers containers
For each container, corresponding glue class Provided for all types in the Java collection frameworks. User's annotation required for user-defined container. These glue methods call profiling library to pass For instrumentation step: call site ID For SC computation the container object the element object the number of elements in the container before the operation is performed operation types are used for SC computation
Soot analysis framework is used Calls to the corresponding glue methods are inserted before and/or after the call site. Code is inserted after a container is allocated in order to track its allocation time. Escape analysis: They do not include thread-local and method-local containers since their lifetime is limited within their allocating methods.
Perform profiling with JVMTI Data for MC values Data for SC values What JVMTI helps for profiling? Activate an object graph traversal thread Calculate the deallocation time of a tagged container. Activate a dumping thread to prevent too much profiling data in memory for performance.
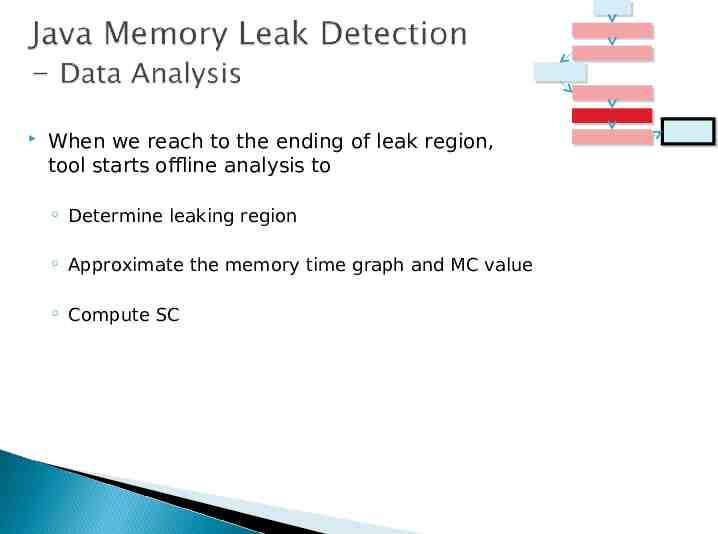
When we reach to the ending of leak region, tool starts offline analysis to Determine leaking region Approximate the memory time graph and MC value Compute SC
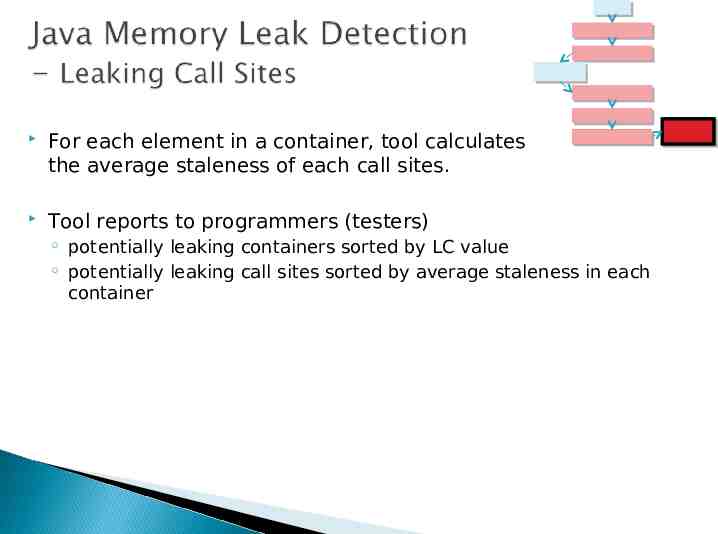
For each element in a container, tool calculates the average staleness of each call sites. Tool reports to programmers (testers) potentially leaking containers sorted by LC value potentially leaking call sites sorted by average staleness in each container
Hardware Platform: 2.4 GHz Dual-core, 2GB RAM Three memory leak bugs Two are from Sun Bug Repository One is from SPECjbb Method Check how successfully their tool can locate a memory leak bug in three different sampling/dumping rates (1/15gc, 1/50gc, 1/85gc) Check overhead and performance by measuring instrumentation overhead, runtime with different size of heap in different sampling rate, and the overhead of using their tool. What they want to show here? Their tool achieved high precision in reporting causes for memory leak bug with acceptable overhead for practical use!
JDK bug #6209673 1. Enough information Image (VolatileImage)volatileMap.get(config) for programmers to locate bugs. JDK bug #6559589 addElement(weakWindow) 2. Sampling rate: 1/15gc and 1/50gc is better than 1/85gc. 1/50gc is the best for tradeoff between performance and preciseness.
1. Requires user-defined container glue class. Before this, tool couldn’t locate a memory leak bug successfully 2. After modeling, it found the correct place for memory leak bug 3. 1/50gc showed the best performance and orderTable.put(anOrder.getId(), anOrder) preciseness.
Static Overhead -# of call sites instrumented -Static overhead of tools Dynamic Overhead -# of gc-events and runtime with the default vs. large heap size in two different samplings Overhead of using this tool 1. Applying escape analysis reduces the number of call sites 2. In the same sampling rate, large initial heap size uses smaller running time 3. Decreasing the sampling rate reduces the runtime overhead
Why they are different from existing dynamic method? Instead of focusing on arbitrary objects, they only focus on containers main contributor of memory leak problem. They consider the combination of MC and SC, not single. They locate a bug more precisely Programmer or testers only need to learn how to add glue class and can use their tool easily instead of learning how to interpret complex outputs from existing tools. Contributions Contribution Contribution Contribution Contribution 1: 2: 3: 4: Computing a Confidence Java Memory leak detection Implementation Empirical Evaluation
How about overhead? Need optimization to reduce overhead Using JikesRVM to avoid JVMTI Automated tool Automate the mapping between container methods to the ADT operations Alternative definition of LC for more precisely information More context information about containers and call sites that can be useful for programmers.
