Exhibit ES–1. Quality of Diabetes Care: MetroPlus Medicaid and


15 Slides529.50 KB
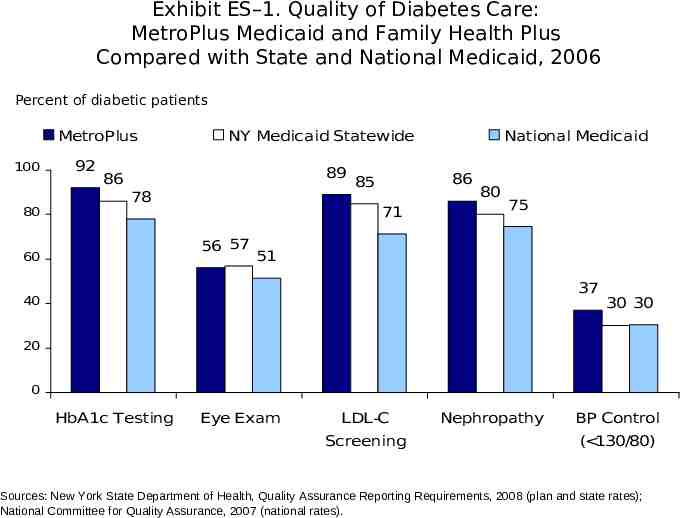
Exhibit ES–1. Quality of Diabetes Care: MetroPlus Medicaid and Family Health Plus Compared with State and National Medicaid, 2006 Percent of diabetic patients MetroPlus 100 80 92 NY Medicaid Statewide 89 86 78 86 85 71 56 57 60 National Medicaid 80 75 51 37 40 30 30 20 0 HbA1c Testing Eye Exam LDL-C Screening Nephropathy BP Control ( 130/80) Sources: New York State Department of Health, Quality Assurance Reporting Requirements, 2008 (plan and state rates); National Committee for Quality Assurance, 2007 (national rates).
Exhibit ES–2. Hospital Quality Indicators: HHC Compared with New York City and National Averages, April 2006–March 2007 Percent of hospital patients receiving appropriate and timely treatment or prevention HHC 100 87 NYC Vicinity 94 81 79 84 80 National 88 85 84 86 84 Pneumonia Preventing care surgical 80 78 60 40 20 0 Heart attack Heart failure infections Source: New York City Health and Hospitals Corporation (HHC) analysis of CMS Hospital Compare data. Averages reflect eight measures for heart attack, four measures for heart failure, seven measures for pneumonia, and two measures for surgical
Exhibit ES–3. MetroPlus Compared with New York City Medicaid Managed Care Plans: Average Ratings for Quality and Patient Satisfaction, 2007 MetroPlus (highest rating) 82 Overall Average rating 63 Rating 42 0 20 40 AmeriGroup Corp. (lowest rating) 60 80 100 Source: New York State Department of Health, 2007 Consumer Guide—Medicaid Managed Care in New York City. Ratings are based on a comparison of plan rates to statewide averages for 11 measures. Average rating calculated by case-study authors as the average of ratings for the 15 New York City plans.
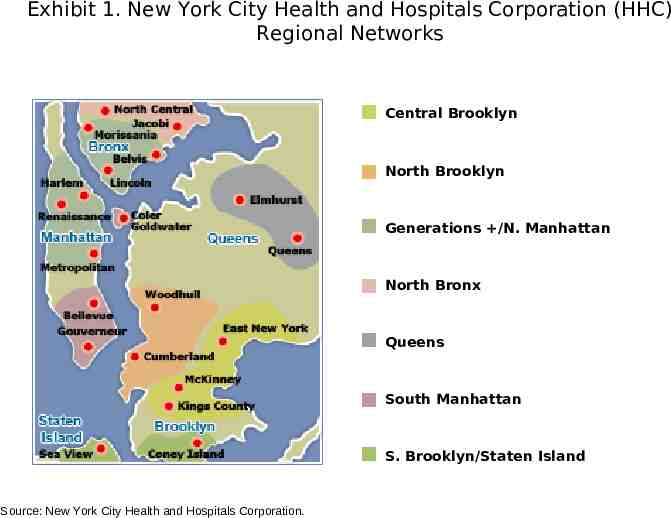
Exhibit 1. New York City Health and Hospitals Corporation (HHC) Regional Networks Central Brooklyn North Brooklyn Generations /N. Manhattan North Bronx Queens South Manhattan S. Brooklyn/Staten Island Source: New York City Health and Hospitals Corporation.
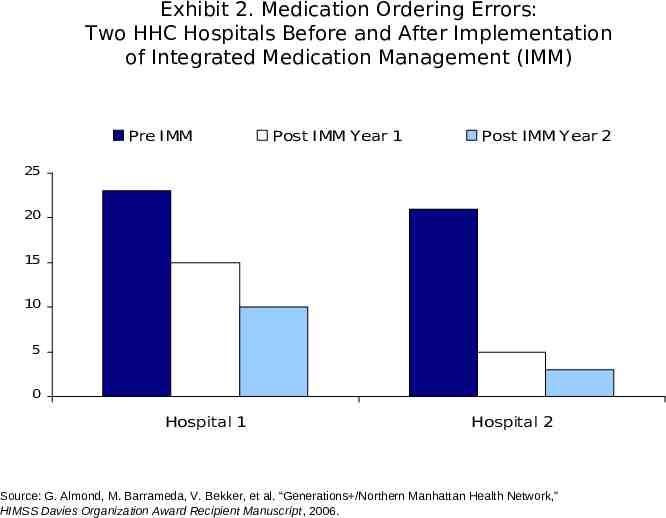
Exhibit 2. Medication Ordering Errors: Two HHC Hospitals Before and After Implementation of Integrated Medication Management (IMM) Pre IMM Post IMM Year 1 Post IMM Year 2 25 20 15 10 5 0 Hospital 1 Hospital 2 Source: G. Almond, M. Barrameda, V. Bekker, et al. “Generations /Northern Manhattan Health Network,” HIMSS Davies Organization Award Recipient Manuscript, 2006.
Exhibit 3. Quality of Diabetes Care: MetroPlus Medicaid and Family Health Plus Compared with State and National Medicaid, 2006 Percent of diabetic patients MetroPlus 100 80 92 NY Medicaid Statewide 89 86 78 86 85 71 56 57 60 National Medicaid 80 75 51 37 40 30 30 20 0 HbA1c Testing Eye Exam LDL-C Screening Nephropathy BP Control ( 130/80) Sources: New York State Department of Health, Quality Assurance Reporting Requirements, 2008 (plan and state rates); National Committee for Quality Assurance, 2007 (national rates).
Exhibit 4. Asthma Hospital Admission Rates: MetroPlus Patients Receiving Care from HHC Providers, 2004–2007 Pediatric patients (percent) Adult patients (percent) 5 5 4.02 4 3.95 3.69 4 3.12 3 3 2 2 1 1 0 0 2004 2005 2006 2007 Source: New York City Health and Hospitals Corporation. 2.48 1.87 2004 2005 1.60 2006 1.36 2007
Exhibit 5. Hospital Quality Indicators: HHC Compared with New York City and National Averages, April 2006–March 2007 Percent of hospital patients receiving appropriate and timely treatment or prevention HHC 100 87 NYC Vicinity 94 81 79 84 80 National 88 85 84 86 84 Pneumonia Preventing care surgical 80 78 60 40 20 0 Heart attack Heart failure infections Source: New York City Health and Hospitals Corporation (HHC) analysis of CMS Hospital Compare data. Averages reflect eight measures for heart attack, four measures for heart failure, seven measures for pneumonia, and two measures for surgical
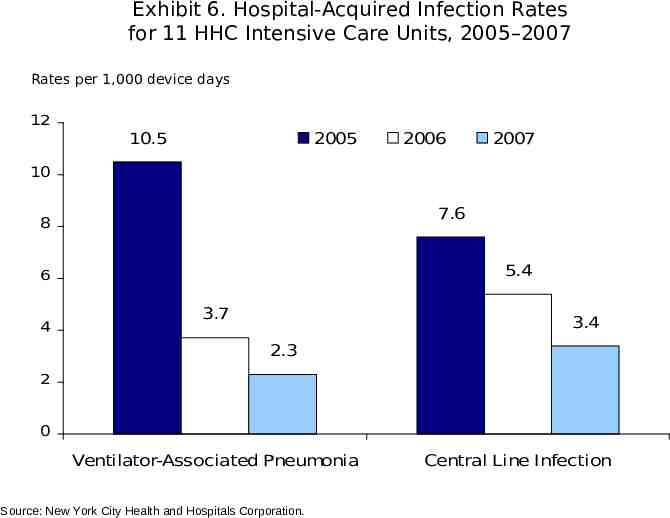
Exhibit 6. Hospital-Acquired Infection Rates for 11 HHC Intensive Care Units, 2005–2007 Rates per 1,000 device days 12 10.5 2005 2006 2007 10 7.6 8 5.4 6 4 3.7 3.4 2.3 2 0 Ventilator-Associated Pneumonia Source: New York City Health and Hospitals Corporation. Central Line Infection
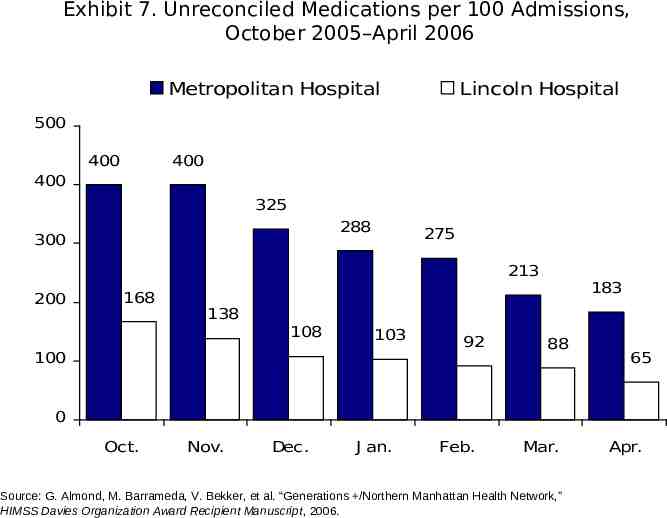
Exhibit 7. Unreconciled Medications per 100 Admissions, October 2005–April 2006 Metropolitan Hospital Lincoln Hospital 500 400 400 400 325 288 300 275 213 200 168 183 138 108 103 100 92 88 65 0 Oct. Nov. Dec. J an. Feb. Mar. Source: G. Almond, M. Barrameda, V. Bekker, et al. “Generations /Northern Manhattan Health Network,” HIMSS Davies Organization Award Recipient Manuscript, 2006. Apr.
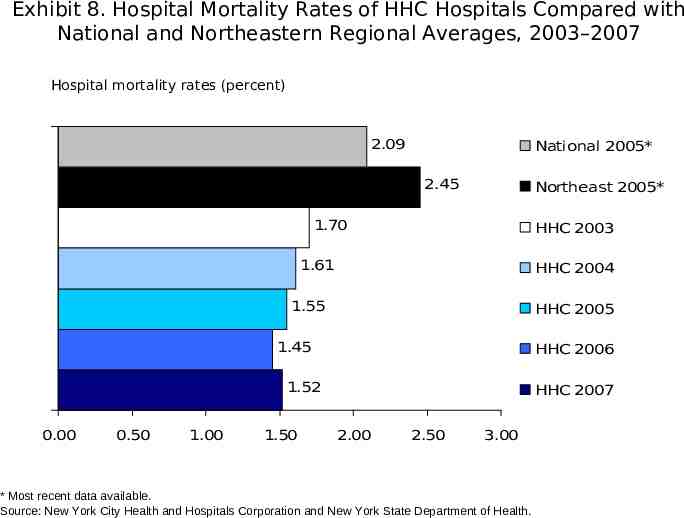
Exhibit 8. Hospital Mortality Rates of HHC Hospitals Compared with National and Northeastern Regional Averages, 2003–2007 Hospital mortality rates (percent) 2.09 National 2005* 2.45 Northeast 2005* 1.70 HHC 2003 1.61 HHC 2004 1.55 HHC 2005 1.45 HHC 2006 1.52 0.00 0.50 1.00 1.50 HHC 2007 2.00 2.50 3.00 * Most recent data available. Source: New York City Health and Hospitals Corporation and New York State Department of Health.
Exhibit 9. MetroPlus Chronic Disease Pay-for-Performance Metrics for Asthma Utilization Rate per Thousand (Population) Point Category Point Threshold ER Benchmark 25 visits per 1,000 ER % Improvement –10% IP Benchmark 5 visits per 1,000 IP % Improvement –10% Percent Utilizing at Acute Level (Individual) Point Category Point Threshold % Utilizing ER 20% % Improvement in ER Utilization –10% % Utilizing IP % Improvement in IP Utilization Source: A. Saperstein, Driving Quality Through Incentives in a Municipal Hospital System, Quality Colloquium, August 20, 2007. ER emergency room; IP inpatient. 4% –10%
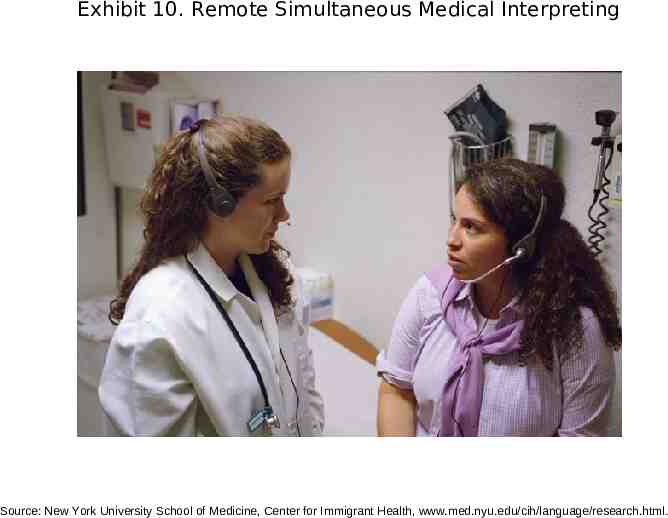
Exhibit 10. Remote Simultaneous Medical Interpreting Source: New York University School of Medicine, Center for Immigrant Health, www.med.nyu.edu/cih/language/research.html.
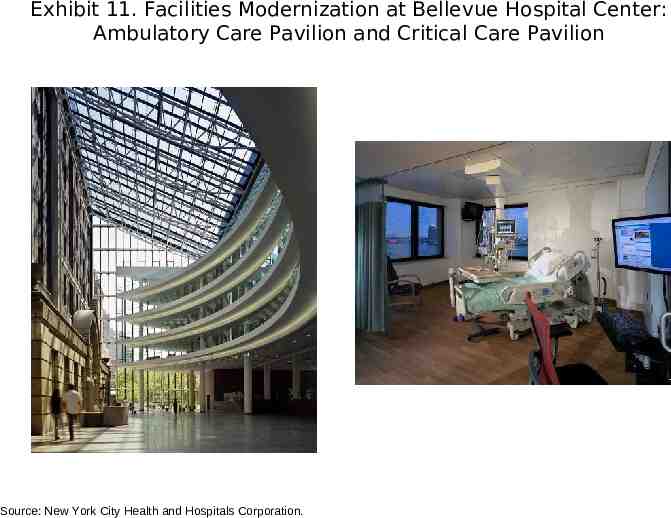
Exhibit 11. Facilities Modernization at Bellevue Hospital Center: Ambulatory Care Pavilion and Critical Care Pavilion Source: New York City Health and Hospitals Corporation.
Exhibit 12. MetroPlus Compared with New York City Medicaid Managed Care Plans: Average Ratings for Quality and Patient Satisfaction, 2007 MetroPlus (highest rating) 82 Overall Average rating 63 Rating 42 0 20 40 AmeriGroup Corp. (lowest rating) 60 80 100 Source: New York State Department of Health, 2007 Consumer Guide – Medicaid Managed Care in New York City. Ratings are based on a comparison of plan rates to statewide averages for 11 measures. Average rating calculated by case-study authors as the average of ratings for the 15 New York City plans.