Code Tuning and Parallelization on Boston University’s
86 Slides1.86 MB
Code Tuning and Parallelization on Boston University’s Scientific Computing Facility Doug Sondak [email protected] Boston University Scientific Computing and Visualization
Outline Introduction Timing Profiling Cache Tuning Timing/profiling exercise Parallelization
Introduction Tuning – Where is most time being used? – How to speed it up Often as much art as science Parallelization – After serial tuning, try parallel processing – MPI – OpenMP
Timing
Timing When tuning/parallelizing a code, need to assess effectiveness of your efforts Can time whole code and/or specific sections Some types of timers – unix time command – function/subroutine calls – profiler
CPU or Wall-Clock Time? both are useful for parallel runs, really want wall-clock time, since CPU time will be about the same or even increase as number of procs. is increased CPU time doesn’t account for wait time wall-clock time may not be accurate if sharing processors – wall-clock timings should always be performed in batch mode
Unix Time Command easiest way to time code simply type time before your run command output differs between c-type shells (cshell, tcshell) and Bourne-type shells (bsh, bash, ksh)
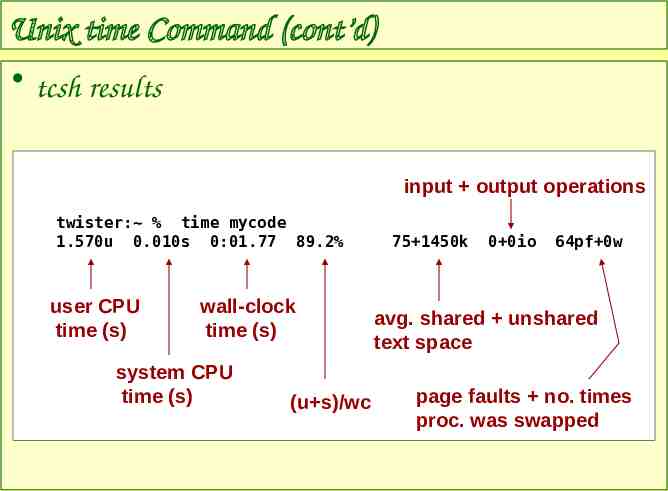
Unix time Command (cont’d) tcsh results input output operations twister: % time mycode 1.570u 0.010s 0:01.77 89.2% user CPU time (s) wall-clock time (s) system CPU time (s) (u s)/wc 75 1450k 0 0io 64pf 0w avg. shared unshared text space page faults no. times proc. was swapped
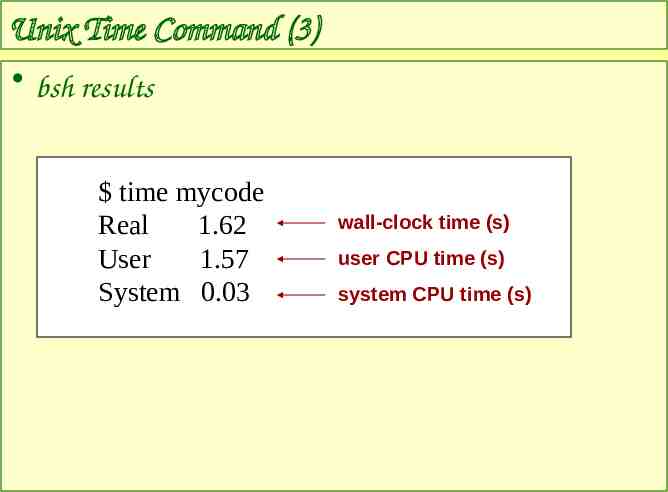
Unix Time Command (3) bsh results time mycode Real 1.62 User 1.57 System 0.03 wall-clock time (s) user CPU time (s) system CPU time (s)
Function/Subroutine Calls often need to time part of code timers can be inserted in source code language-dependent
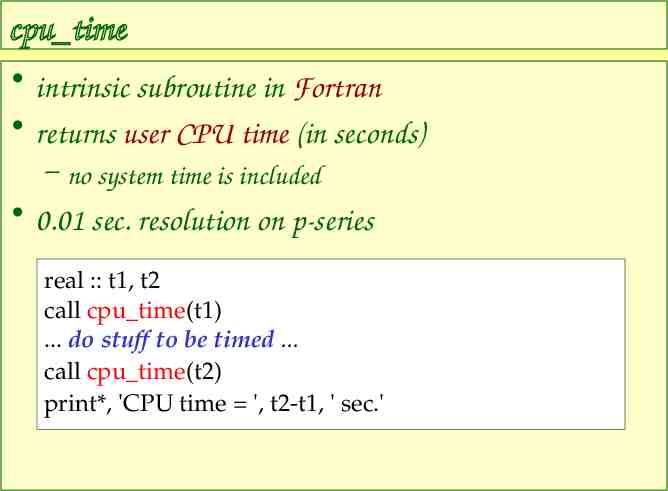
cpu time intrinsic subroutine in Fortran returns user CPU time (in seconds) – no system time is included 0.01 sec. resolution on p-series real :: t1, t2 call cpu time(t1) . do stuff to be timed . call cpu time(t2) print*, 'CPU time ', t2-t1, ' sec.'
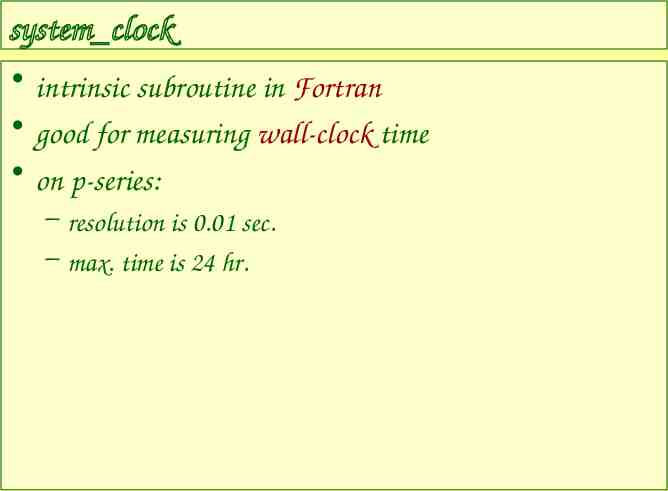
system clock intrinsic subroutine in Fortran good for measuring wall-clock time on p-series: – resolution is 0.01 sec. – max. time is 24 hr.
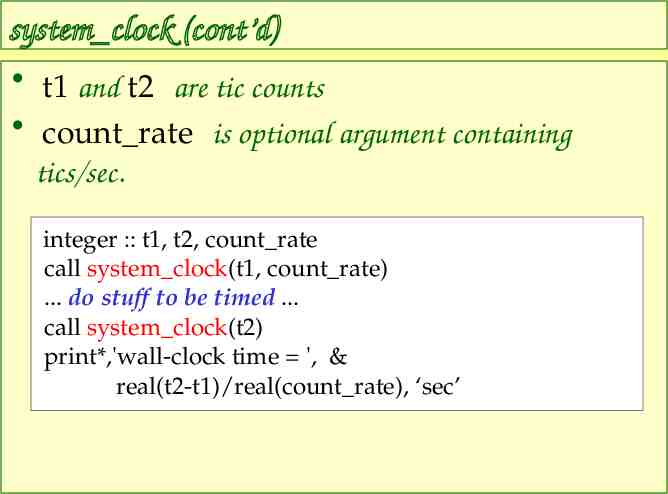
system clock (cont’d) t1 and t2 are tic counts count rate is optional argument containing tics/sec. integer :: t1, t2, count rate call system clock(t1, count rate) . do stuff to be timed . call system clock(t2) print*,'wall-clock time ', & real(t2-t1)/real(count rate), ‘sec’
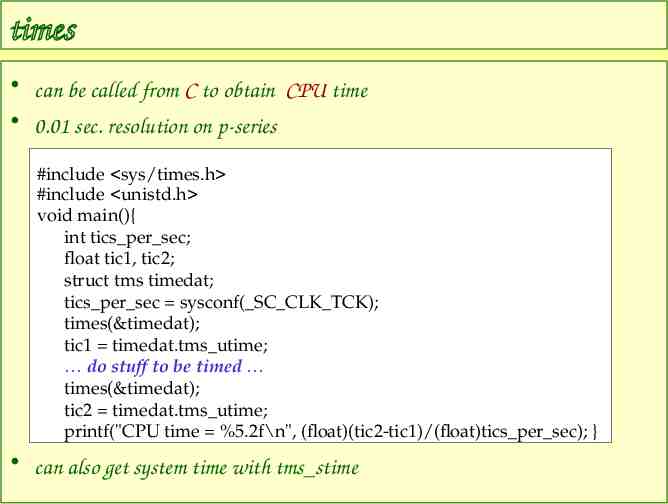
times can be called from C to obtain CPU time 0.01 sec. resolution on p-series #include sys/times.h #include unistd.h void main(){ int tics per sec; float tic1, tic2; struct tms timedat; tics per sec sysconf( SC CLK TCK); times(&timedat); tic1 timedat.tms utime; do stuff to be timed times(&timedat); tic2 timedat.tms utime; printf("CPU time %5.2f\n", (float)(tic2-tic1)/(float)tics per sec); } can also get system time with tms stime
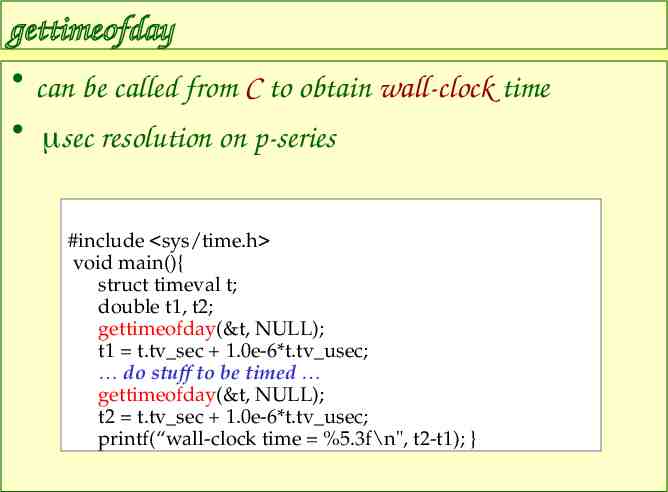
gettimeofday can be called from C to obtain wall-clock time sec resolution on p-series #include sys/time.h void main(){ struct timeval t; double t1, t2; gettimeofday(&t, NULL); t1 t.tv sec 1.0e-6*t.tv usec; do stuff to be timed gettimeofday(&t, NULL); t2 t.tv sec 1.0e-6*t.tv usec; printf(“wall-clock time %5.3f\n", t2-t1); }
MPI Wtime convenient wall-clock timer for MPI codes sec resolution on p-series
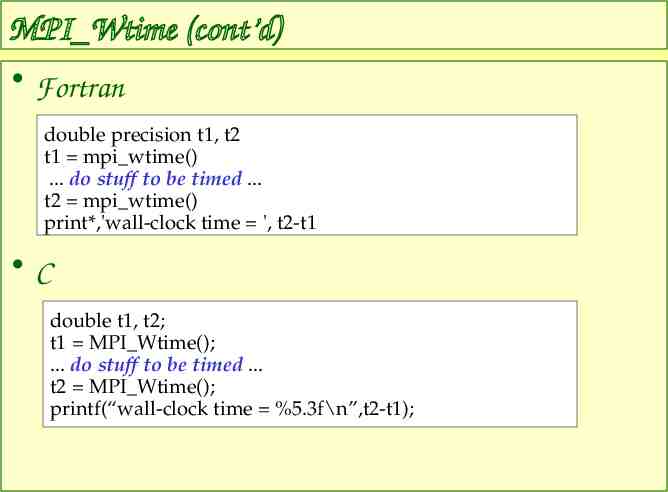
MPI Wtime (cont’d) Fortran double precision t1, t2 t1 mpi wtime() . do stuff to be timed . t2 mpi wtime() print*,'wall-clock time ', t2-t1 C double t1, t2; t1 MPI Wtime(); . do stuff to be timed . t2 MPI Wtime(); printf(“wall-clock time %5.3f\n”,t2-t1);
omp get wtime convenient wall-clock timer for OpenMP codes resolution available by calling omp get wtick() 0.01 sec. resolution on p-series
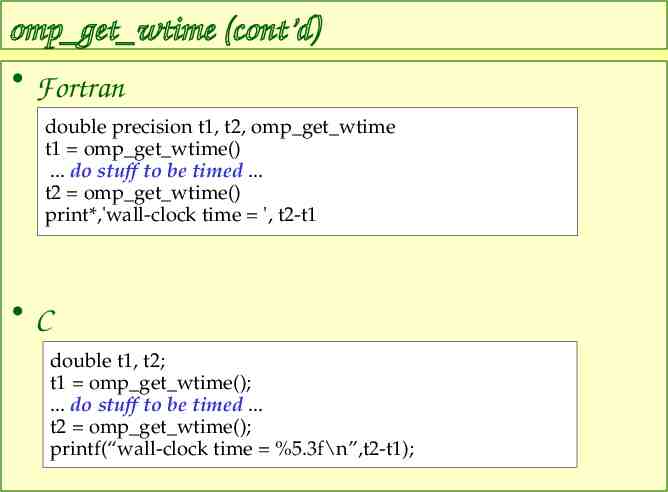
omp get wtime (cont’d) Fortran double precision t1, t2, omp get wtime t1 omp get wtime() . do stuff to be timed . t2 omp get wtime() print*,'wall-clock time ', t2-t1 C double t1, t2; t1 omp get wtime(); . do stuff to be timed . t2 omp get wtime(); printf(“wall-clock time %5.3f\n”,t2-t1);
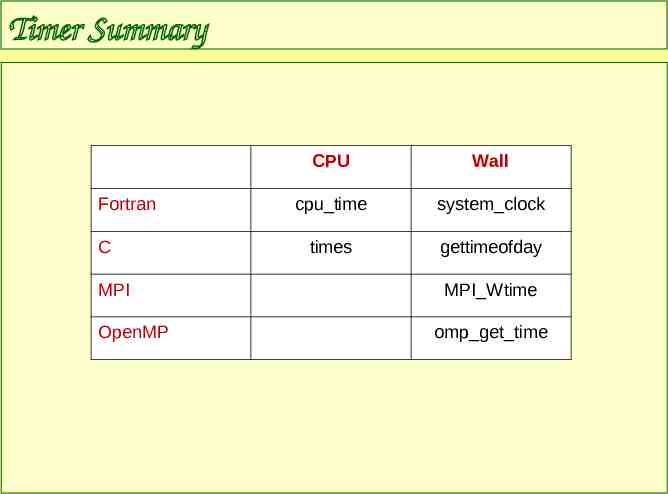
Timer Summary Fortran C MPI OpenMP CPU Wall cpu time system clock times gettimeofday MPI Wtime omp get time
Profiling
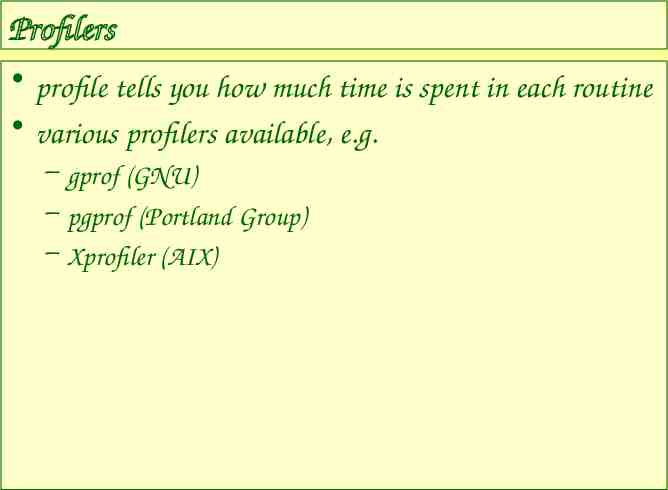
Profilers profile tells you how much time is spent in each routine various profilers available, e.g. – gprof (GNU) – pgprof (Portland Group) – Xprofiler (AIX)
gprof compile with -pg file gmon.out will be created when you run gprof executable myprof for multiple procs. (MPI), copy or link gmon.out.n to gmon.out, then run gprof
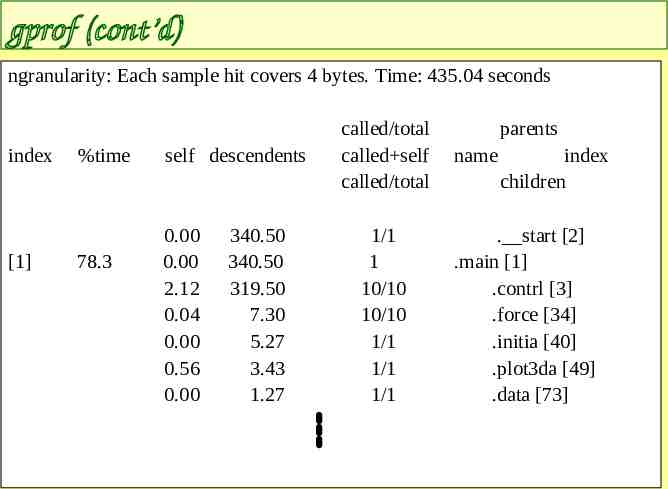
gprof (cont’d) ngranularity: Each sample hit covers 4 bytes. Time: 435.04 seconds index [1] %time 78.3 self descendents 0.00 0.00 2.12 0.04 0.00 0.56 0.00 340.50 340.50 319.50 7.30 5.27 3.43 1.27 called/total called self called/total 1/1 1 10/10 10/10 1/1 1/1 1/1 parents name index children . start [2] .main [1] .contrl [3] .force [34] .initia [40] .plot3da [49] .data [73]
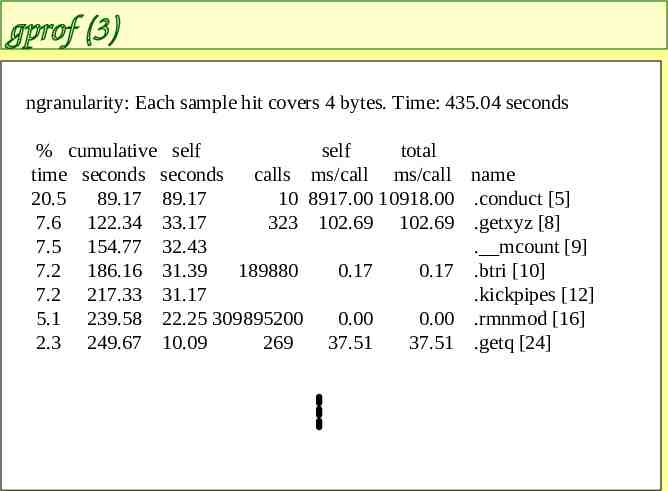
gprof (3) ngranularity: Each sample hit covers 4 bytes. Time: 435.04 seconds % cumulative self self total time seconds seconds calls ms/call ms/call name 20.5 89.17 89.17 10 8917.00 10918.00 .conduct [5] 7.6 122.34 33.17 323 102.69 102.69 .getxyz [8] 7.5 154.77 32.43 . mcount [9] 7.2 186.16 31.39 189880 0.17 0.17 .btri [10] 7.2 217.33 31.17 .kickpipes [12] 5.1 239.58 22.25 309895200 0.00 0.00 .rmnmod [16] 2.3 249.67 10.09 269 37.51 37.51 .getq [24]
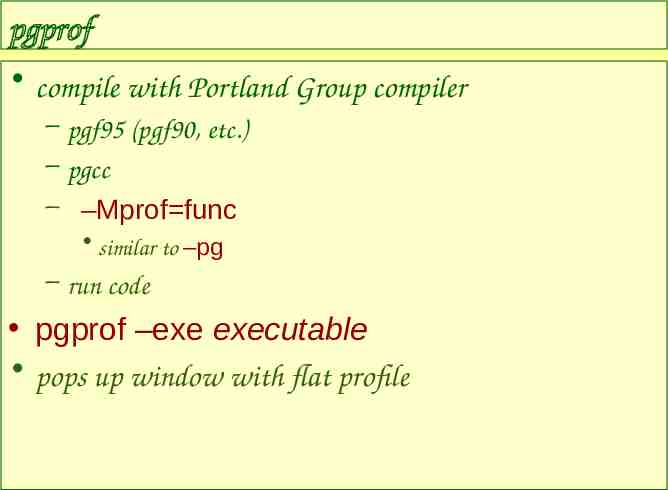
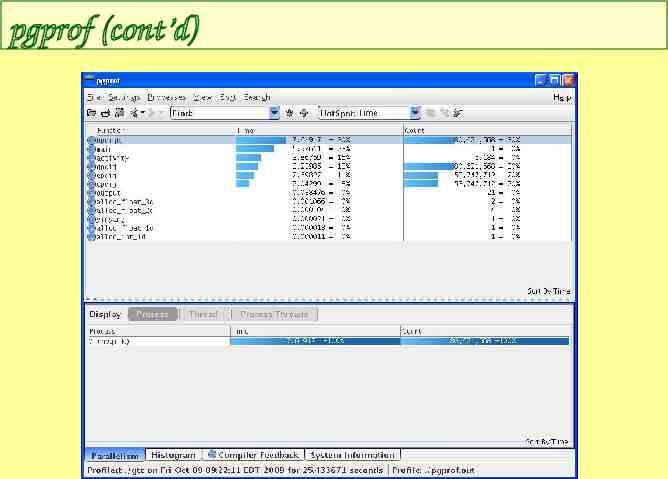
pgprof compile with Portland Group compiler – pgf95 (pgf90, etc.) – pgcc – –Mprof func similar to –pg – run code pgprof –exe executable pops up window with flat profile
pgprof (cont’d)
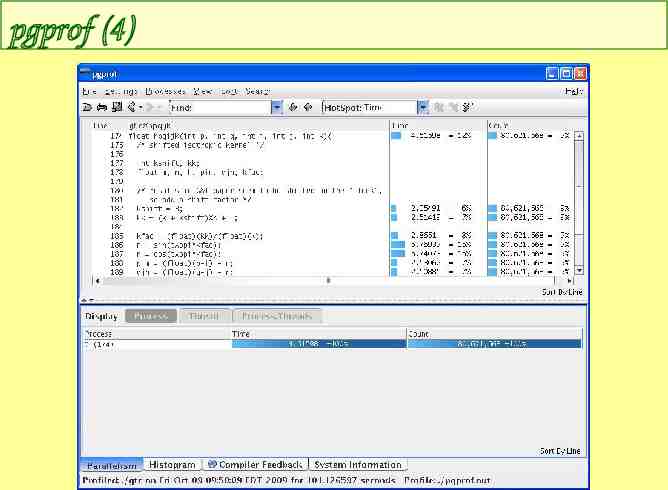
pgprof (3) line-level profiling – –Mprof line optimizer will re-order lines – profiler will lump lines in some loops or other constructs – may want to compile without optimization, may not in flat profile, double-click on function
pgprof (4)
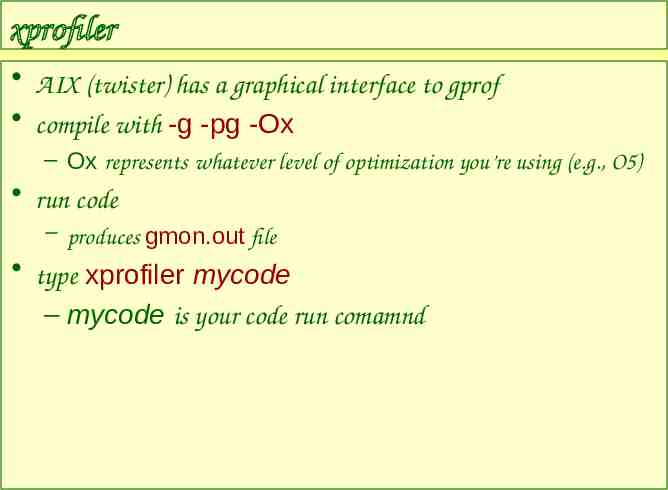
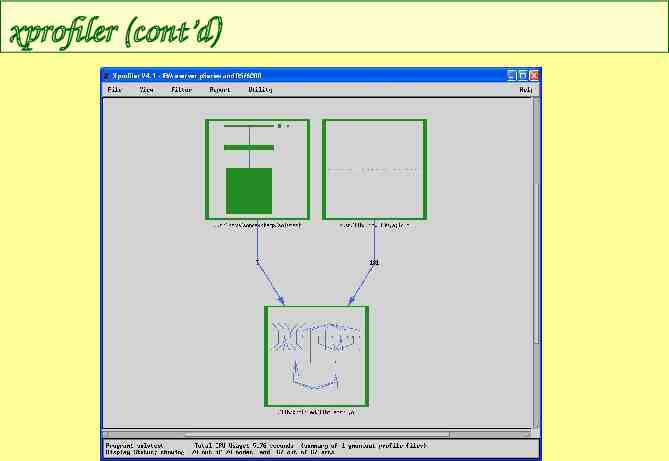
xprofiler AIX (twister) has a graphical interface to gprof compile with -g -pg -Ox – Ox represents whatever level of optimization you’re using (e.g., O5) run code – produces gmon.out file type xprofiler mycode – mycode is your code run comamnd
xprofiler (cont’d)
xprofiler (3) filled boxes represent functions or subroutines “fences” represent libraries left-click a box to get function name and timing information right-click on box to get source code or other information
xprofiler (4) can also get same profiles as from gprof by using menus – report – report flat profile call graph profile
Cache
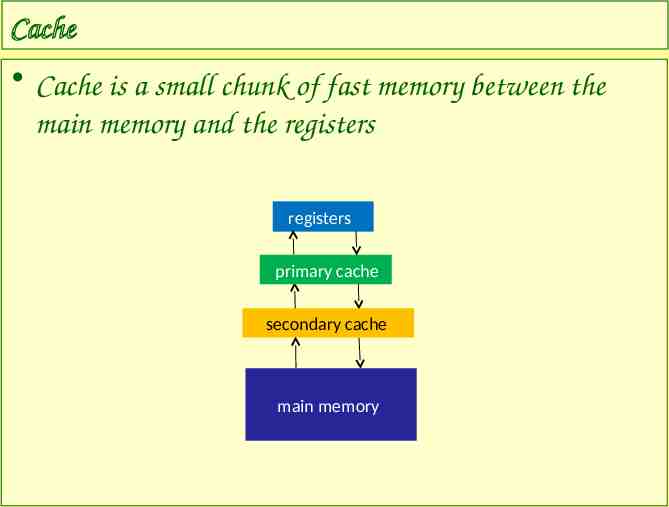
Cache Cache is a small chunk of fast memory between the main memory and the registers registers primary cache secondary cache main memory
Cache (cont’d) Variables are moved from main memory to cache in lines – L1 cache line sizes on our machines Opteron (katana cluster) 64 bytes Power4 (p-series) 128 bytes PPC440 (Blue Gene) 32 bytes Pentium III (linux cluster) 32 bytes If variables are used repeatedly, code will run faster since cache memory is much faster than main memory
Cache (cont’d) Why not just make the main memory out of the same stuff as cache? – Expensive – Runs hot – This was actually done in Cray computers Liquid cooling system
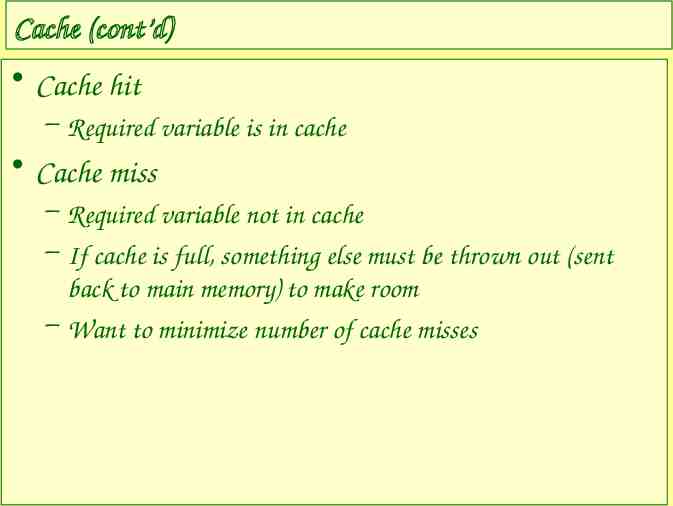
Cache (cont’d) Cache hit – Required variable is in cache Cache miss – Required variable not in cache – If cache is full, something else must be thrown out (sent back to main memory) to make room – Want to minimize number of cache misses
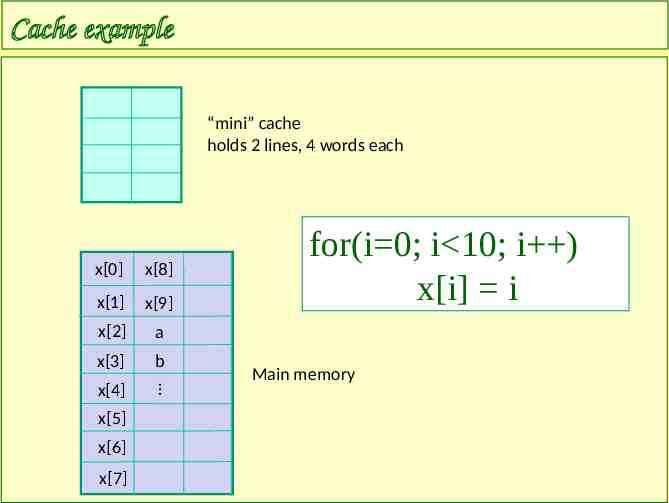
Cache example “mini” cache holds 2 lines, 4 words each x[0] x[8] x[1] x[9] x[2] a x[3] b x[4] x[6] x[7] Main memory x[5] for(i 0; i 10; i ) x[i] i
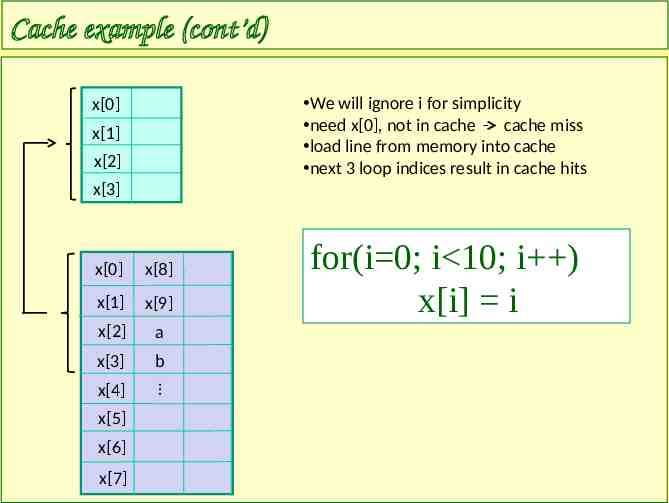
Cache example (cont’d) We will ignore i for simplicity need x[0], not in cache cache miss load line from memory into cache next 3 loop indices result in cache hits x[0] x[1] x[2] x[3] x[0] x[8] x[1] x[9] x[2] a x[3] b x[4] x[6] x[7] x[5] for(i 0; i 10; i ) x[i] i
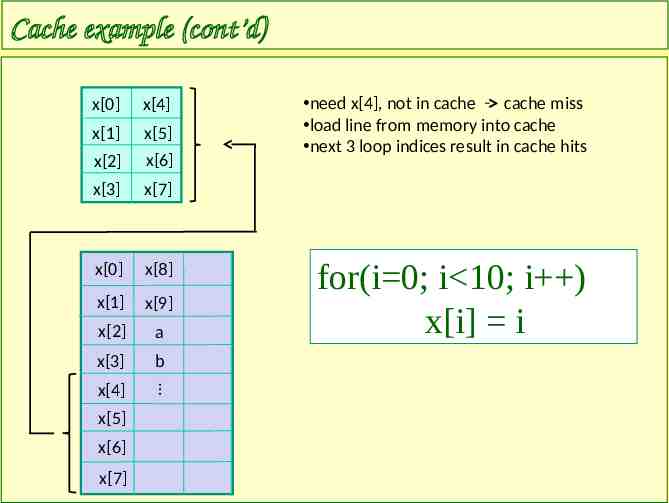
Cache example (cont’d) x[0] x[4] x[1] x[5] x[2] x[6] x[3] x[7] x[0] x[8] x[1] x[9] x[2] a x[3] b x[4] x[6] x[7] for(i 0; i 10; i ) x[i] i x[5] need x[4], not in cache cache miss load line from memory into cache next 3 loop indices result in cache hits
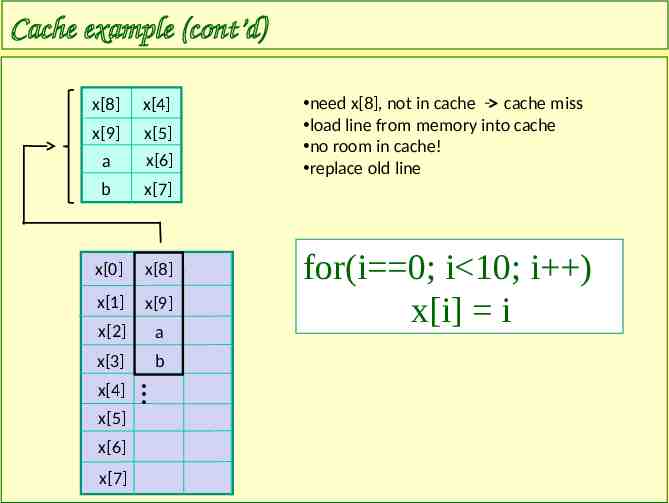
Cache example (cont’d) x[8] x[4] x[9] x[5] a x[6] b x[7] x[0] x[8] x[1] x[9] x[2] a x[3] b x[4] x[6] x[7] for(i 0; i 10; i ) x[i] i x[5] need x[8], not in cache cache miss load line from memory into cache no room in cache! replace old line
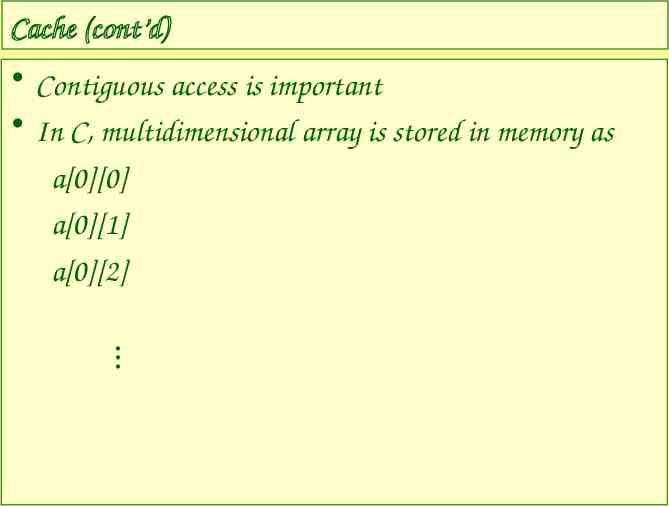
Cache (cont’d) Contiguous access is important In C, multidimensional array is stored in memory as a[0][0] a[0][1] a[0][2]
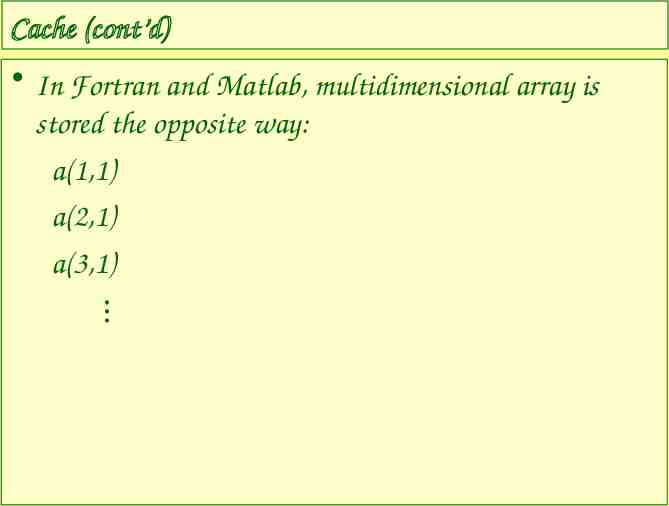
Cache (cont’d) In Fortran and Matlab, multidimensional array is stored the opposite way: a(1,1) a(2,1) a(3,1)
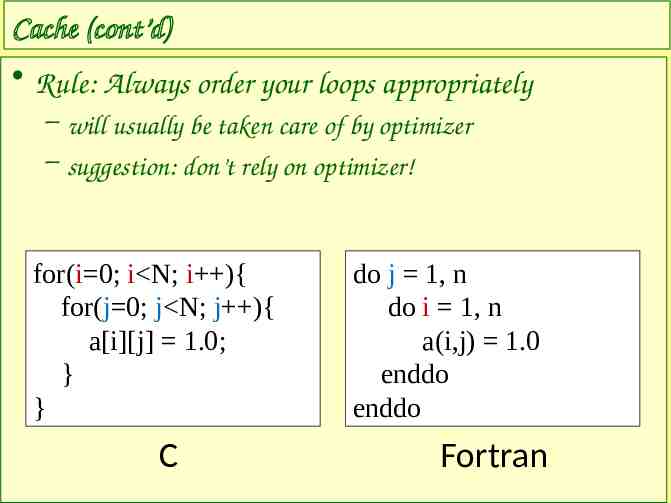
Cache (cont’d) Rule: Always order your loops appropriately – will usually be taken care of by optimizer – suggestion: don’t rely on optimizer! for(i 0; i N; i ){ for(j 0; j N; j ){ a[i][j] 1.0; } } C do j 1, n do i 1, n a(i,j) 1.0 enddo enddo Fortran
Tuning Tips
Tuning Tips Some of these tips will be taken care of by compiler optimization – It’s best to do them yourself, since compilers vary
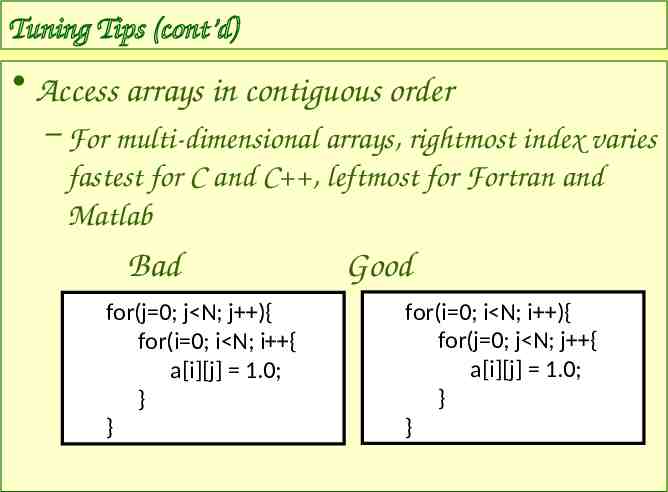
Tuning Tips (cont’d) Access arrays in contiguous order – For multi-dimensional arrays, rightmost index varies fastest for C and C , leftmost for Fortran and Matlab Bad for(j 0; j N; j ){ for(i 0; i N; i { a[i][j] 1.0; } } Good for(i 0; i N; i ){ for(j 0; j N; j { a[i][j] 1.0; } }
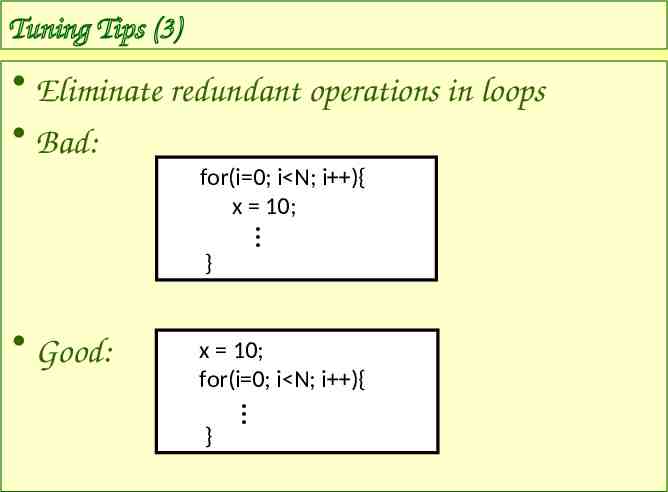
Tuning Tips (3) Eliminate redundant operations in loops Bad: for(i 0; i N; i ){ x 10; } Good: x 10; for(i 0; i N; i ){ }
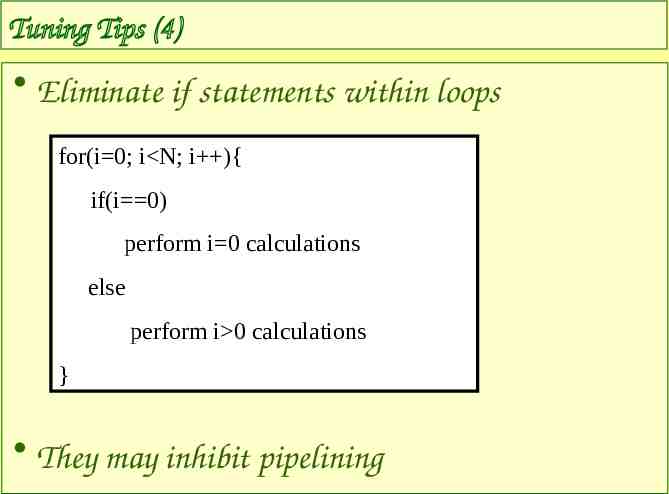
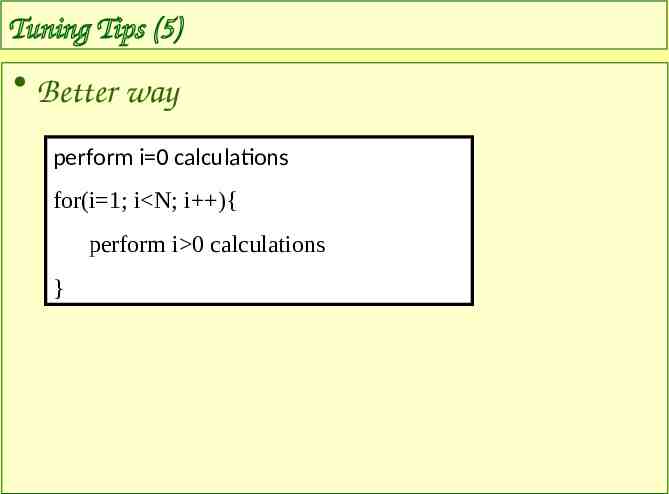
Tuning Tips (4) Eliminate if statements within loops for(i 0; i N; i ){ if(i 0) perform i 0 calculations else perform i 0 calculations } They may inhibit pipelining
Tuning Tips (5) Better way perform i 0 calculations for(i 1; i N; i ){ perform i 0 calculations }
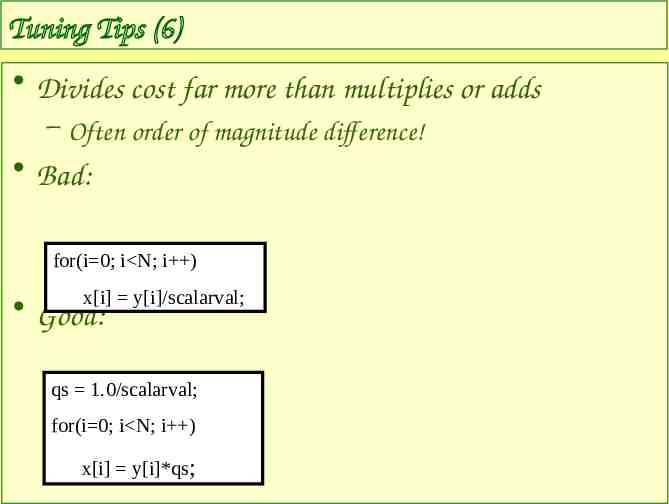
Tuning Tips (6) Divides cost far more than multiplies or adds – Often order of magnitude difference! Bad: for(i 0; i N; i ) x[i] y[i]/scalarval; Good: qs 1.0/scalarval; for(i 0; i N; i ) x[i] y[i]*qs;
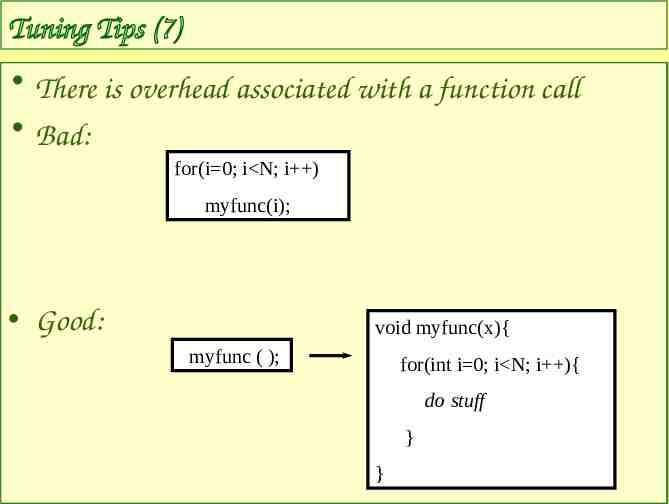
Tuning Tips (7) There is overhead associated with a function call Bad: for(i 0; i N; i ) myfunc(i); Good: void myfunc(x){ myfunc ( ); for(int i 0; i N; i ){ do stuff } }
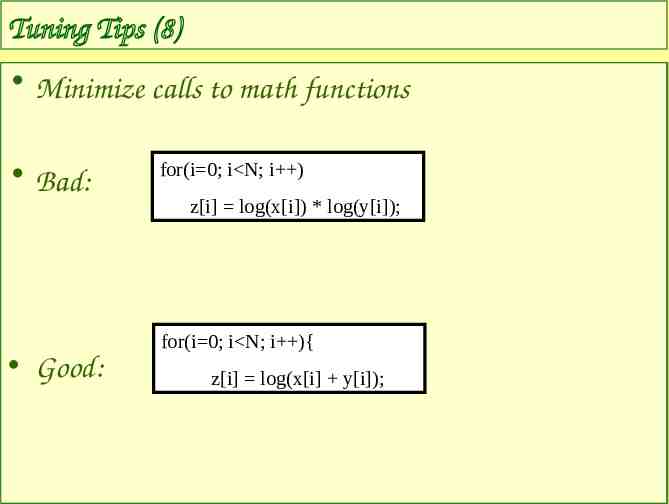
Tuning Tips (8) Minimize There is overhead calls to associated math functions with a function call Bad: Good: for(i 0; i N; i ) z[i] log(x[i]) * log(y[i]); for(i 0; i N; i ){ z[i] log(x[i] y[i]);
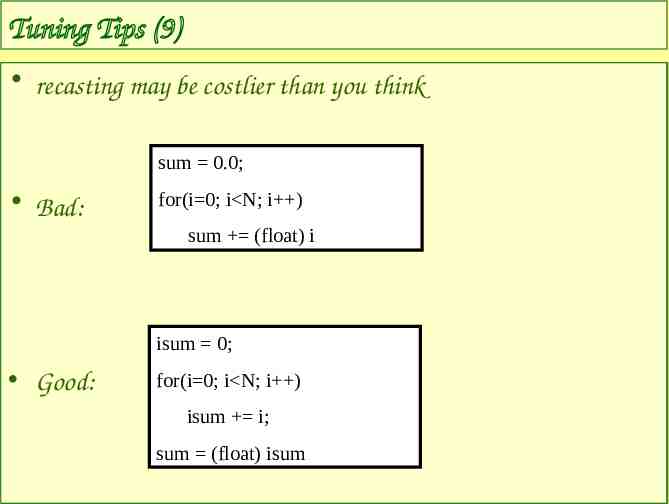
Tuning Tips (9) recasting be costlier than youwith thinka function call There is may overhead associated sum 0.0; Bad: for(i 0; i N; i ) sum (float) i isum 0; Good: for(i 0; i N; i ) isum i; sum (float) isum
Parallelization
Parallelization Introduction MPI & OpenMP Performance metrics Amdahl’s Law
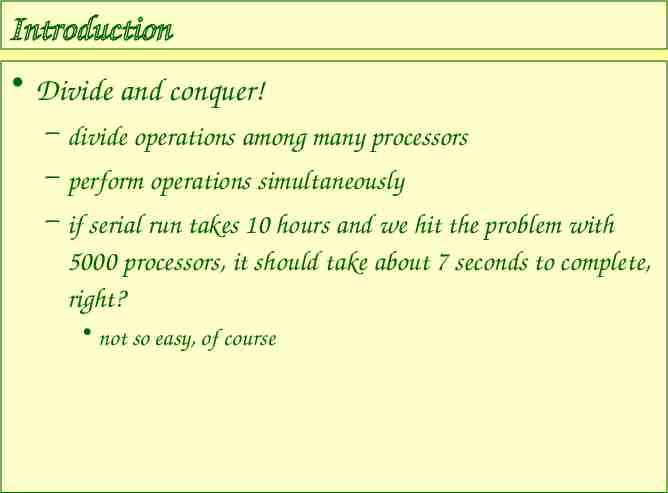
Introduction Divide and conquer! – divide operations among many processors – perform operations simultaneously – if serial run takes 10 hours and we hit the problem with 5000 processors, it should take about 7 seconds to complete, right? not so easy, of course
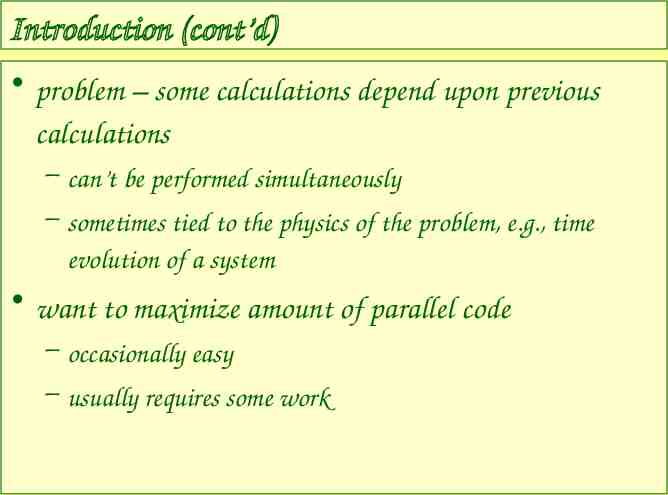
Introduction (cont’d) problem – some calculations depend upon previous calculations – can’t be performed simultaneously – sometimes tied to the physics of the problem, e.g., time evolution of a system want to maximize amount of parallel code – occasionally easy – usually requires some work
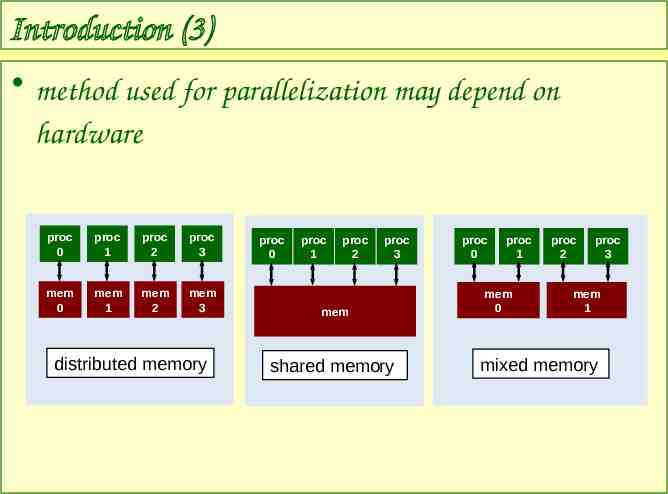
Introduction (3) method used for parallelization may depend on hardware proc 0 proc 1 proc 2 proc 3 mem 0 mem 1 mem 2 mem 3 distributed memory proc 0 proc 1 proc 2 proc 3 mem shared memory proc 0 proc 1 mem 0 proc 2 proc 3 mem 1 mixed memory
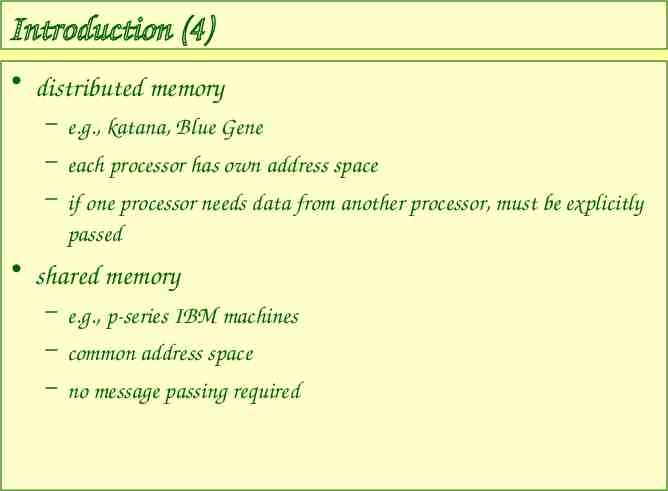
Introduction (4) distributed memory – e.g., katana, Blue Gene – each processor has own address space – if one processor needs data from another processor, must be explicitly passed shared memory – e.g., p-series IBM machines – common address space – no message passing required
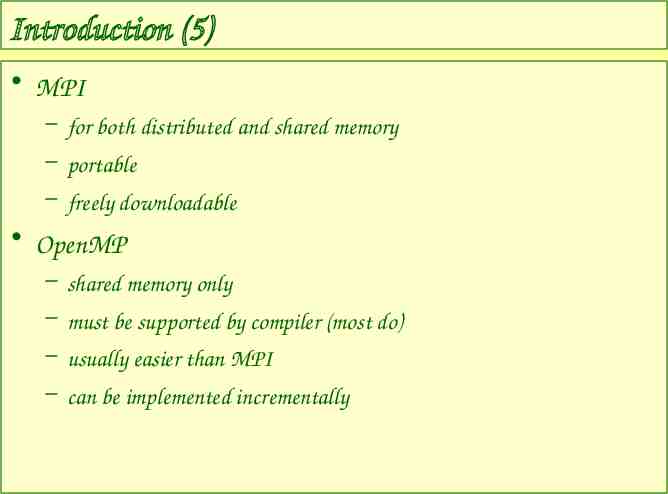
Introduction (5) MPI – for both distributed and shared memory – portable – freely downloadable OpenMP – shared memory only – must be supported by compiler (most do) – usually easier than MPI – can be implemented incrementally
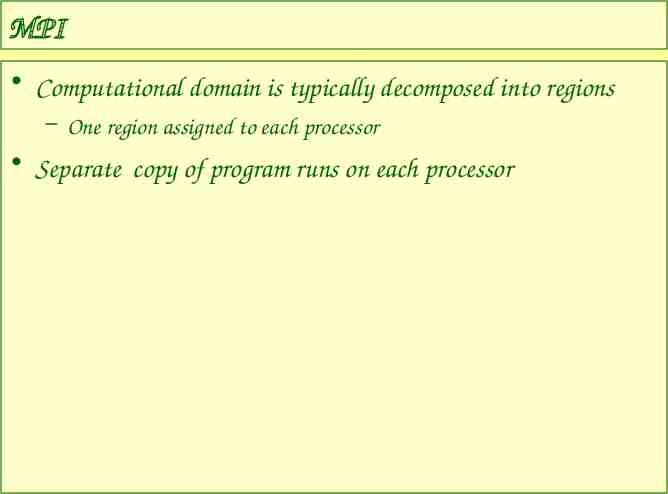
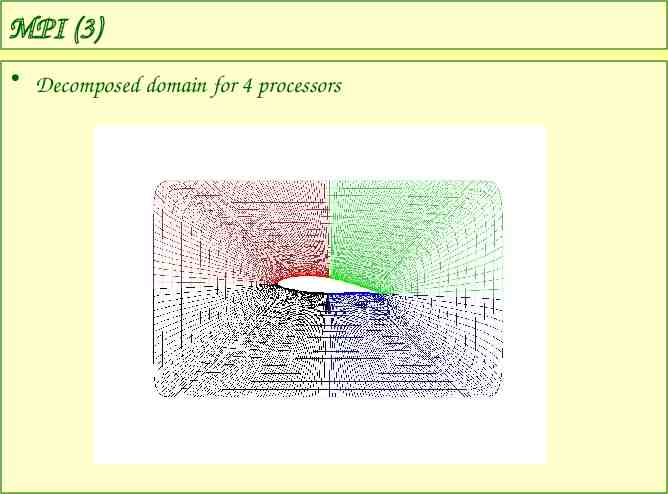
MPI Computational domain is typically decomposed into regions – One region assigned to each processor Separate copy of program runs on each processor
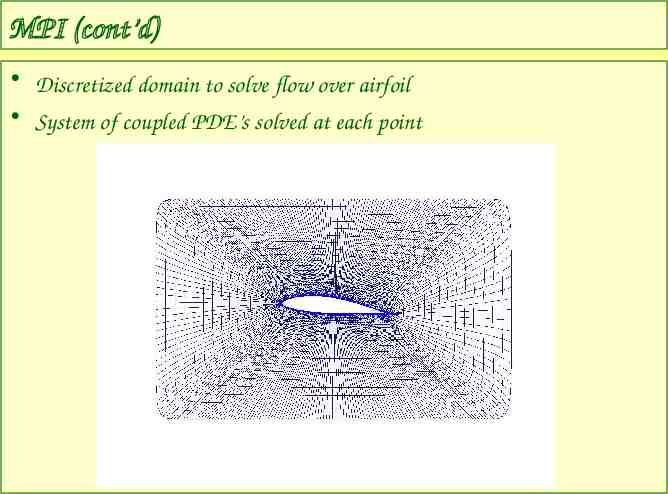
MPI (cont’d) Discretized domain to solve flow over airfoil System of coupled PDE’s solved at each point
MPI (3) Decomposed domain for 4 processors
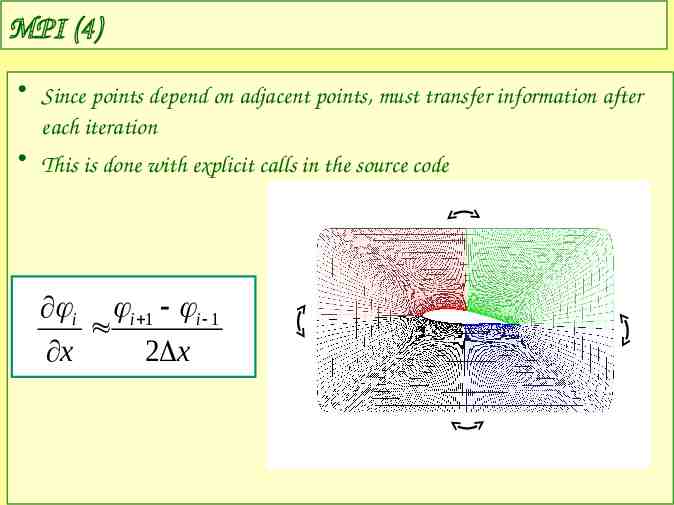
MPI (4) Since points depend on adjacent points, must transfer information after each iteration This is done with explicit calls in the source code i i 1 i 1 x 2 x
MPI (5) Diminishing returns – Sending messages can get expensive – Want to maximize ratio of computation to communication
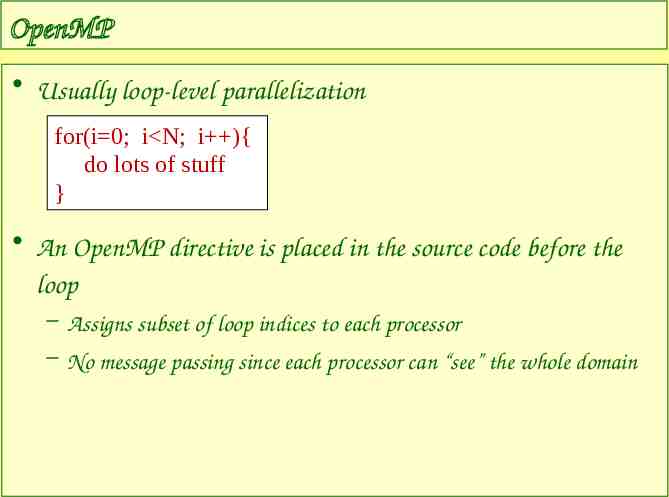
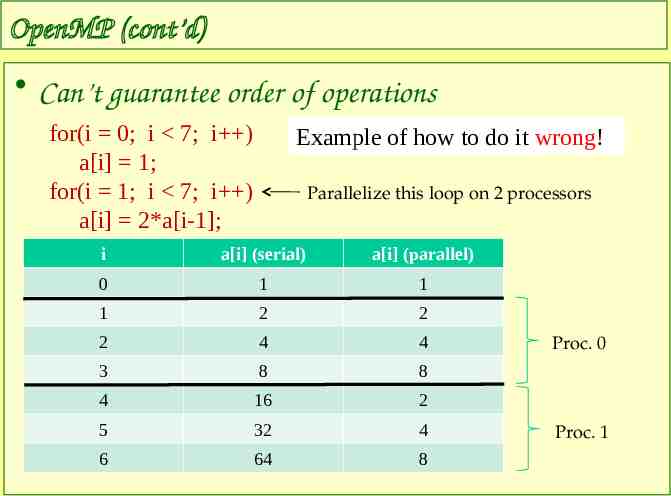
OpenMP Usually loop-level parallelization for(i 0; i N; i ){ do lots of stuff } An OpenMP directive is placed in the source code before the loop – Assigns subset of loop indices to each processor – No message passing since each processor can “see” the whole domain
OpenMP (cont’d) Can’t guarantee order of operations for(i 0; i 7; i ) a[i] 1; for(i 1; i 7; i ) a[i] 2*a[i-1]; Example of how to do it wrong! Parallelize this loop on 2 processors i a[i] (serial) a[i] (parallel) 0 1 1 1 2 2 2 4 4 3 8 8 4 16 2 5 32 4 6 64 8 Proc. 0 Proc. 1
Quantify performance Two common methods – parallel speedup – parallel efficiency
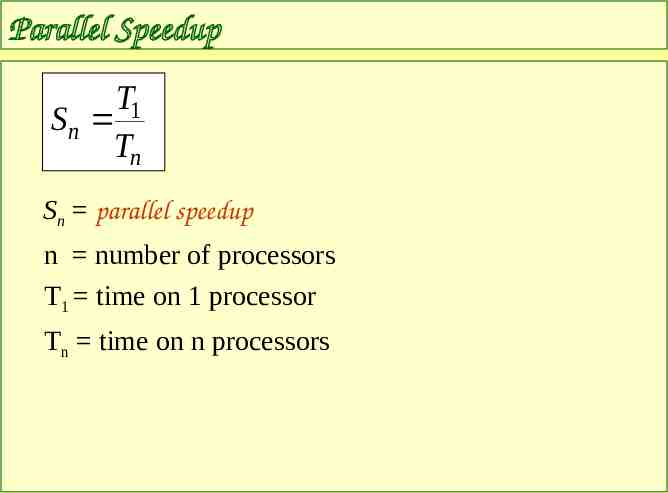
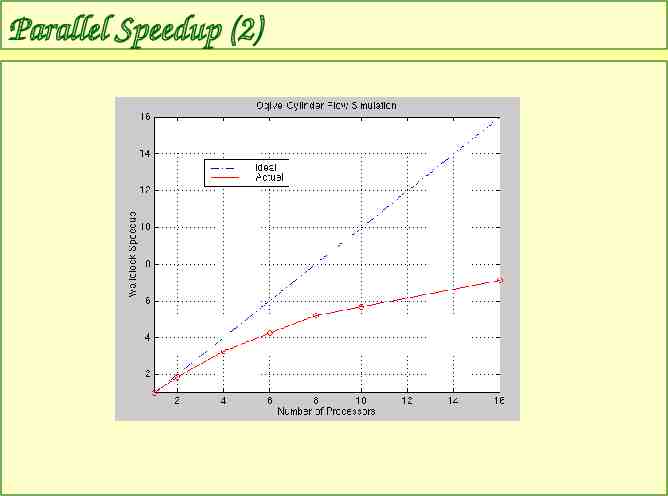
Parallel Speedup T1 Sn Tn Sn parallel speedup n number of processors T1 time on 1 processor Tn time on n processors
Parallel Speedup (2)
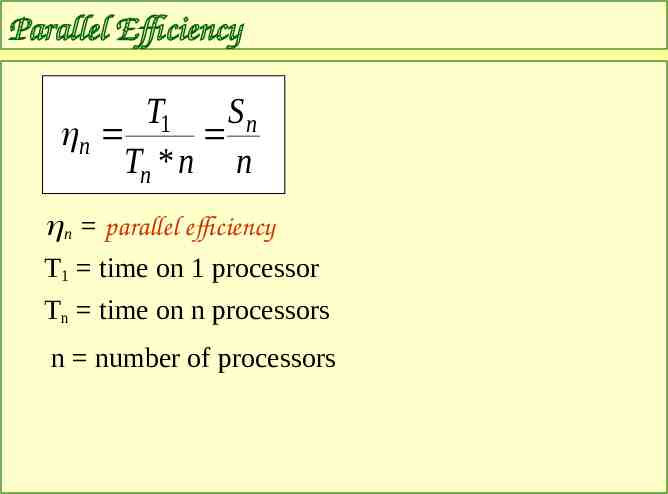
Parallel Efficiency T1 Sn n Tn * n n n parallel efficiency T1 time on 1 processor Tn time on n processors n number of processors
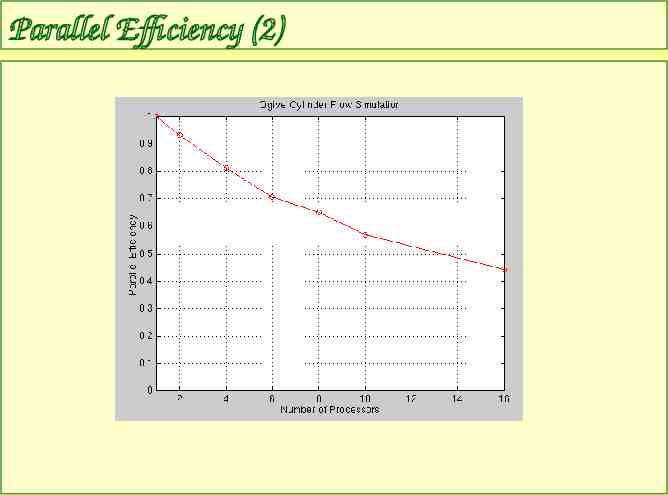
Parallel Efficiency (2)
Parallel Efficiency (3) What is a “reasonable” level of parallel efficiency? depends on – how much CPU time you have available – when the paper is due can think of (1- ) as “wasted” CPU time my personal rule of thumb 60%
Parallel Efficiency (4) Superlinear speedup – parallel efficiency 1.0 – sometimes quoted in the literature – generally attributed to cache issues subdomains fit entirely in cache, entire domain does not this is very problem-dependent be suspicious!
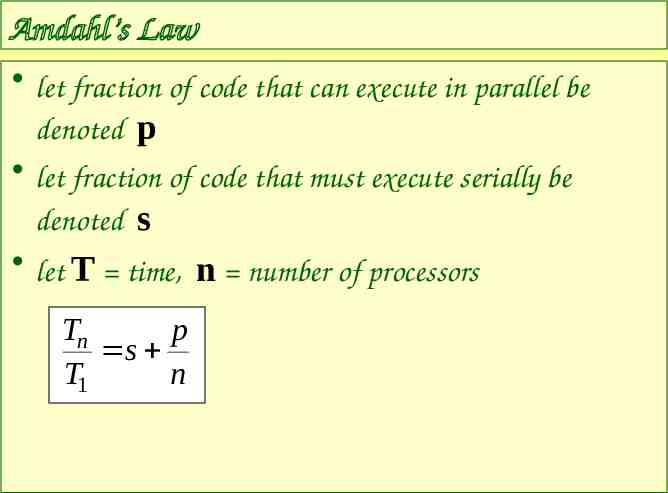
Amdahl’s Law let fraction of code that can execute in parallel be denoted p let fraction of code that must execute serially be denoted s let T time, n number of processors Tn p s T1 n
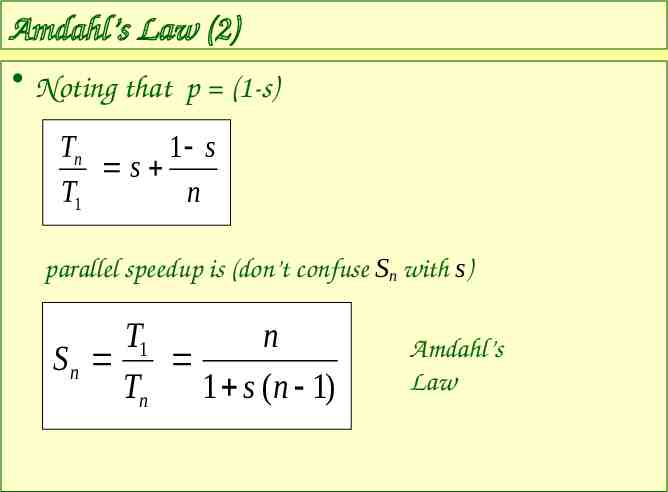
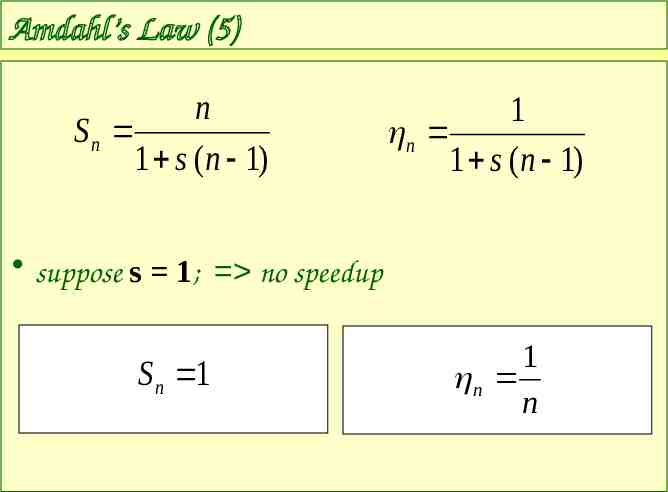
Amdahl’s Law (2) Noting that p (1-s) Tn 1 s s T1 n parallel speedup is (don’t confuse Sn with s) T1 n Sn Tn 1 s (n 1) Amdahl’s Law
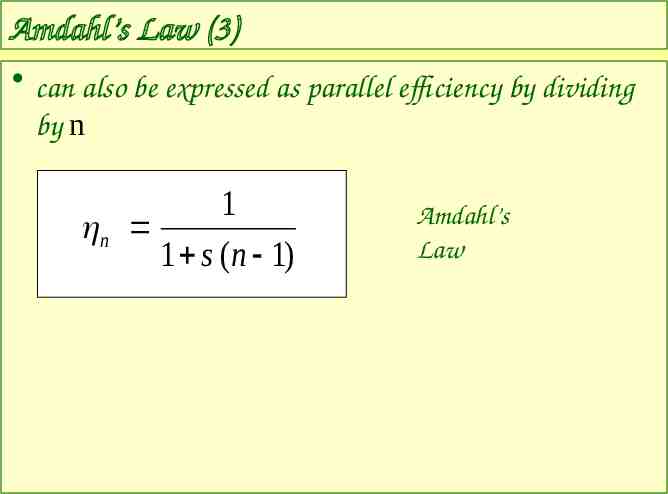
Amdahl’s Law (3) can also be expressed as parallel efficiency by dividing by n 1 n 1 s (n 1) Amdahl’s Law
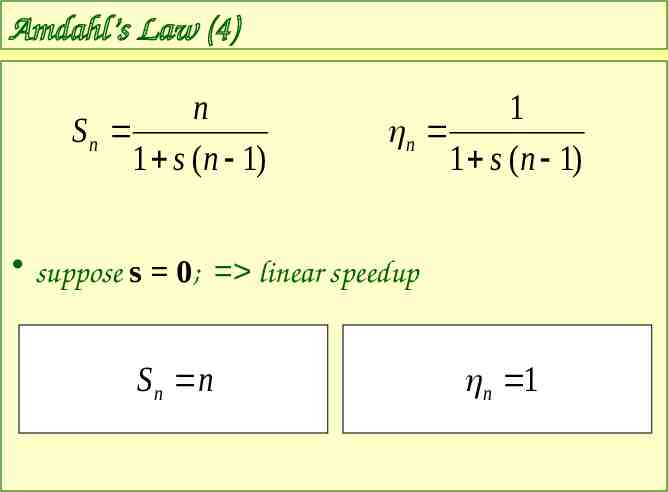
Amdahl’s Law (4) n Sn 1 s (n 1) 1 n 1 s (n 1) suppose s 0; linear speedup S n n n 1
Amdahl’s Law (5) n Sn 1 s (n 1) 1 n 1 s (n 1) suppose s 1; no speedup S n 1 1 n n
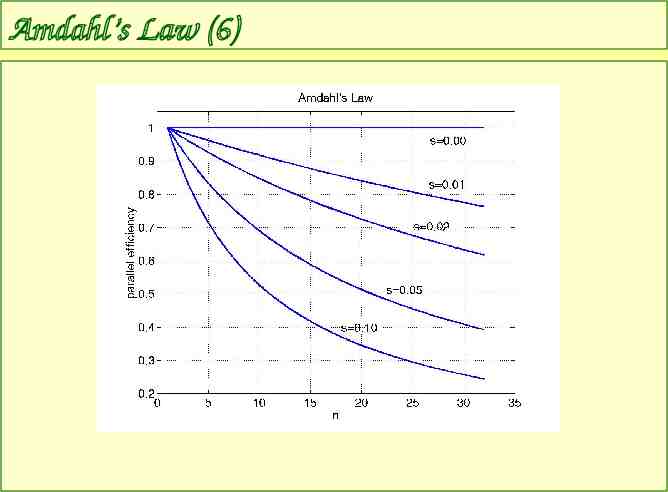
Amdahl’s Law (6)
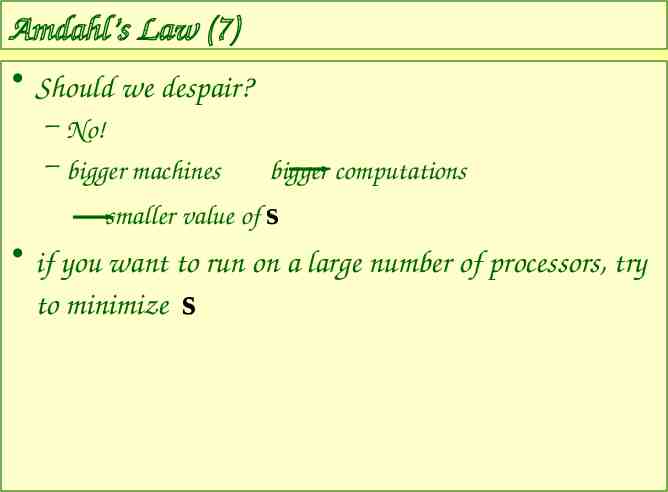
Amdahl’s Law (7) Should we despair? – No! – bigger machines bigger computations smaller value of s if you want to run on a large number of processors, try to minimize s
Recommendations
Recommendations Add timers to your code – As you make changes and/or run new cases, they may give you an indication of a problem Profile your code – Sometimes results are surprising – Review “tuning tips” – See if you can speed up functions that are consuming the most time Try highest levels of compiler optimization
Recommendations (cont’d) Once you’re comfortable that you’re getting reasonable serial performance, parallelize If portability is an issue, MPI is a good choice If you’ll always be running on a shared-memory machine (e.g., multicore PC), consider OpenMP For parallel code, plot parallel efficiency vs. number of processors – Choose appropriate number of processors

