Chapter 3: Using Maintenance & Troubleshooting Tools and
43 Slides701.52 KB
Chapter 3: Using Maintenance & Troubleshooting Tools and Applications CCNP TSHOOT: Maintaining and Troubleshooting IP Networks
Chapter 3 Objectives Use Cisco IOS commands to gather information in support of diagnostic processes. Identify tools used for specific maintenance and troubleshooting processes.
Using Cisco IOS Software for Maintenance and Troubleshooting
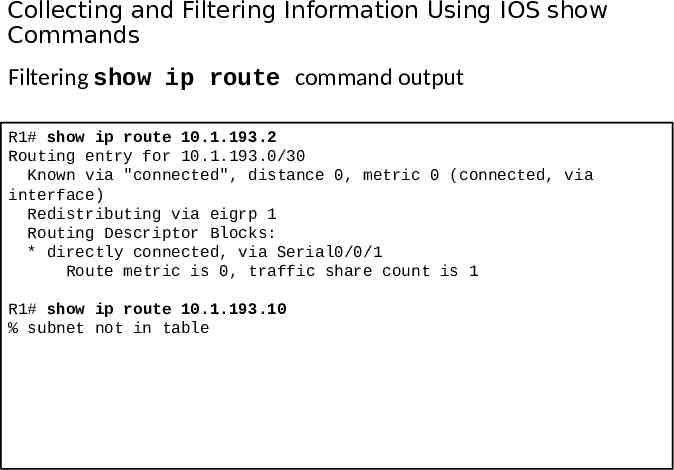
Collecting and Filtering Information Using IOS show Commands Filtering show ip route command output R1# show ip route 10.1.193.2 Routing entry for 10.1.193.0/30 Known via "connected", distance 0, metric 0 (connected, via interface) Redistributing via eigrp 1 Routing Descriptor Blocks: * directly connected, via Serial0/0/1 Route metric is 0, traffic share count is 1 R1# show ip route 10.1.193.10 % subnet not in table
Collecting and Filtering Information Using IOS show Commands – Cont. Using show ip route with network addresses R1# show ip route output omitted C 192.168.1.0/30 is subnetted, 1 subnets 192.168.1.0 is directly connected, Loopback0 R1# show ip route 192.168.1.0 Routing entry for 192.168.1.0/30, 1 known subnets Attached (1 connections) C 192.168.1.0 is directly connected, Loopback0 R1# show ip route 192.168.1.0 255.255.255.252 Routing entry for 192.168.1.0/30 Known via "connected", distance 0, metric 0 (connected, via interface) Routing Descriptor Blocks: * directly connected, via Loopback0 Route metric is 0, traffic share count is 1
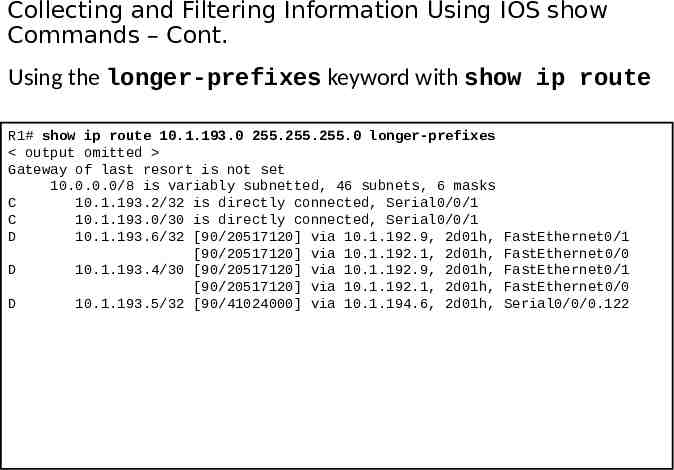
Collecting and Filtering Information Using IOS show Commands – Cont. Using the longer-prefixes keyword with show ip route R1# show ip route 10.1.193.0 255.255.255.0 longer-prefixes output omitted Gateway of last resort is not set 10.0.0.0/8 is variably subnetted, 46 subnets, 6 masks C 10.1.193.2/32 is directly connected, Serial0/0/1 C 10.1.193.0/30 is directly connected, Serial0/0/1 D 10.1.193.6/32 [90/20517120] via 10.1.192.9, 2d01h, [90/20517120] via 10.1.192.1, 2d01h, D 10.1.193.4/30 [90/20517120] via 10.1.192.9, 2d01h, [90/20517120] via 10.1.192.1, 2d01h, D 10.1.193.5/32 [90/41024000] via 10.1.194.6, 2d01h, FastEthernet0/1 FastEthernet0/0 FastEthernet0/1 FastEthernet0/0 Serial0/0/0.122
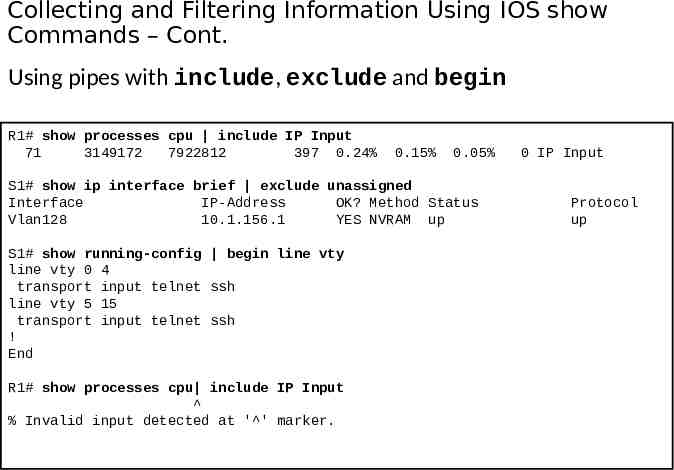
Collecting and Filtering Information Using IOS show Commands – Cont. Using pipes with include, exclude and begin R1# show processes cpu include IP Input 71 3149172 7922812 397 0.24% 0.15% 0.05% S1# show ip interface brief exclude unassigned Interface IP-Address OK? Method Status Vlan128 10.1.156.1 YES NVRAM up S1# show running-config begin line vty line vty 0 4 transport input telnet ssh line vty 5 15 transport input telnet ssh ! End R1# show processes cpu include IP Input % Invalid input detected at ' ' marker. 0 IP Input Protocol up
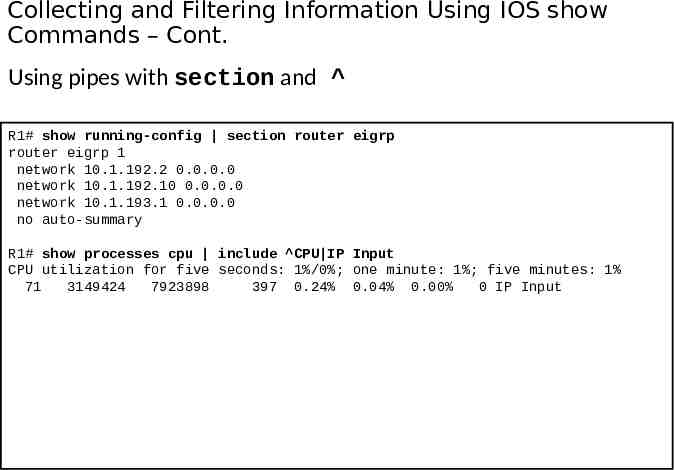
Collecting and Filtering Information Using IOS show Commands – Cont. Using pipes with section and R1# show running-config section router eigrp router eigrp 1 network 10.1.192.2 0.0.0.0 network 10.1.192.10 0.0.0.0 network 10.1.193.1 0.0.0.0 no auto-summary R1# show processes cpu include CPU IP Input CPU utilization for five seconds: 1%/0%; one minute: 1%; five minutes: 1% 71 3149424 7923898 397 0.24% 0.04% 0.00% 0 IP Input
Collecting and Filtering Information Using IOS show Commands – Cont. Using the redirect and tee options R1# show tech-support redirect tftp://192.168.37.2/show-tech.txt R1# show ip interface brief tee flash:show-int-brief.txt Interface IP-Address OK? Method Status Protocol FastEthernet0/0 10.1.192.2 YES manual up up FastEthernet0/1 10.1.192.10 YES manual up up Loopback0 10.1.220.1 YES manual up up R1# dir flash: Directory of flash:/ 1 -rw- 23361156 Mar 2 2009 16:25:54 -08:00 c1841-advipservicesk9mz.1243.bin 2 -rw680 Mar 7 2010 02:16:56 -08:00 show-int-brief.txt
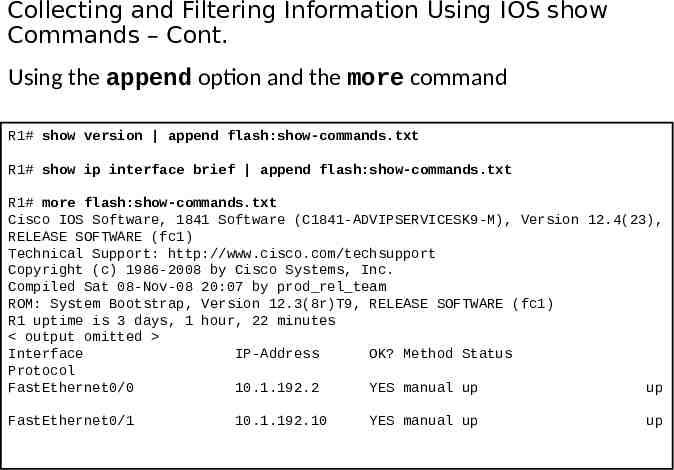
Collecting and Filtering Information Using IOS show Commands – Cont. Using the append option and the more command R1# show version append flash:show-commands.txt R1# show ip interface brief append flash:show-commands.txt R1# more flash:show-commands.txt Cisco IOS Software, 1841 Software (C1841-ADVIPSERVICESK9-M), Version 12.4(23), RELEASE SOFTWARE (fc1) Technical Support: http://www.cisco.com/techsupport Copyright (c) 1986-2008 by Cisco Systems, Inc. Compiled Sat 08-Nov-08 20:07 by prod rel team ROM: System Bootstrap, Version 12.3(8r)T9, RELEASE SOFTWARE (fc1) R1 uptime is 3 days, 1 hour, 22 minutes output omitted Interface IP-Address OK? Method Status Protocol FastEthernet0/0 10.1.192.2 YES manual up up FastEthernet0/1 10.1.192.10 YES manual up up
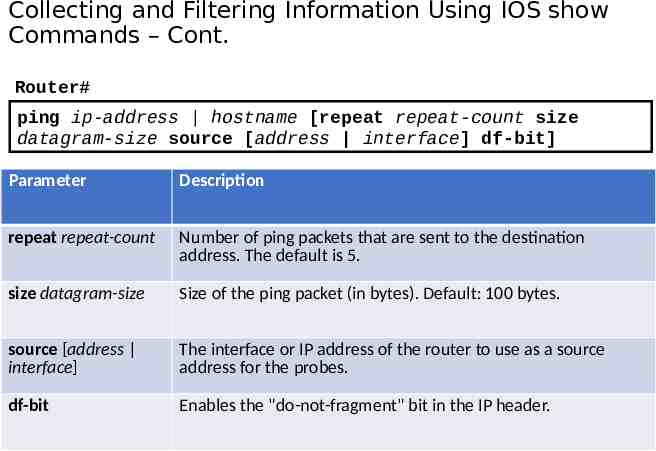
Collecting and Filtering Information Using IOS show Commands – Cont. Router# ping ip-address hostname [repeat repeat-count size datagram-size source [address interface] df-bit] Parameter Description repeat repeat-count Number of ping packets that are sent to the destination address. The default is 5. size datagram-size Size of the ping packet (in bytes). Default: 100 bytes. source [address interface] The interface or IP address of the router to use as a source address for the probes. df-bit Enables the "do-not-fragment" bit in the IP header.
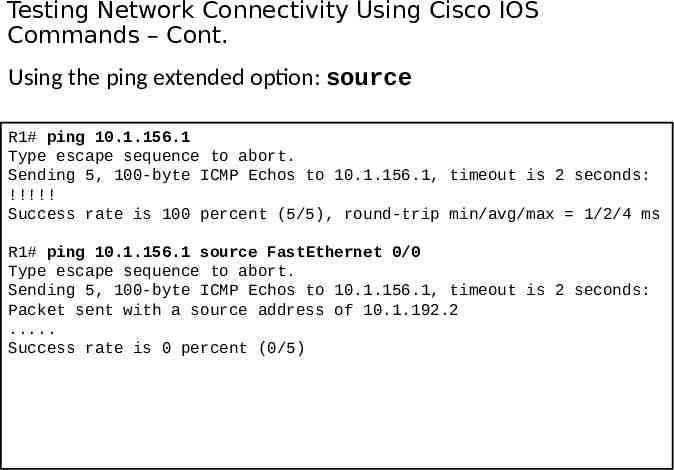
Testing Network Connectivity Using Cisco IOS Commands – Cont. Using the ping extended option: source R1# ping 10.1.156.1 Type escape sequence to abort. Sending 5, 100-byte ICMP Echos to 10.1.156.1, timeout is 2 seconds: !!!!! Success rate is 100 percent (5/5), round-trip min/avg/max 1/2/4 ms R1# ping 10.1.156.1 source FastEthernet 0/0 Type escape sequence to abort. Sending 5, 100-byte ICMP Echos to 10.1.156.1, timeout is 2 seconds: Packet sent with a source address of 10.1.192.2 . Success rate is 0 percent (0/5)
Testing Network Connectivity Using Cisco IOS Commands – Cont. Using the ping extended option: df-bit R1# ping 10.1.221.1 size 1476 df-bit Type escape sequence to abort. Sending 5, 1476-byte ICMP Echos to 10.1.221.1, timeout is 2 seconds: Packet sent with the DF bit set !!!!! Success rate is 100 percent (5/5), round-trip min/avg/max 184/189/193 ms R1# ping 10.1.221.1 size 1477 df-bit Type escape sequence to abort. Sending 5, 1477-byte ICMP Echos to 10.1.221.1, timeout is 2 seconds: Packet sent with the DF bit set M.M.M Success rate is 0 percent (0/5)
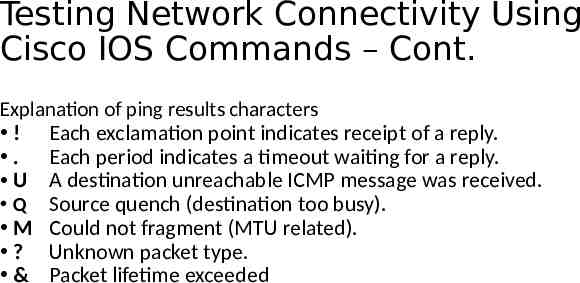
Testing Network Connectivity Using Cisco IOS Commands – Cont. Explanation of ping results characters ! Each exclamation point indicates receipt of a reply. . Each period indicates a timeout waiting for a reply. U A destination unreachable ICMP message was received. Q Source quench (destination too busy). M Could not fragment (MTU related). ? Unknown packet type. & Packet lifetime exceeded
Testing Network Connectivity Using Cisco IOS Commands – Cont. Using the ping extended prompt mode R1# ping Protocol [ip]: Target IP address: 10.1.221.1 Repeat count [5]: 1 Datagram size [100]: Timeout in seconds [2]: Extended commands [n]: y Source address or interface: Type of service [0]: Set DF bit in IP header? [no]: yes Validate reply data? [no]: Data pattern [0xABCD]: Loose, Strict, Record, Timestamp, Verbose[none]: Sweep range of sizes [n]: y Sweep min size [36]: 1400 Sweep max size [18024]: 1500 Sweep interval [1]: Type escape sequence to abort. Sending 101, [1400.1500]-byte ICMP Echos to 10.1.221.1, timeout is 2 seconds: output omitted
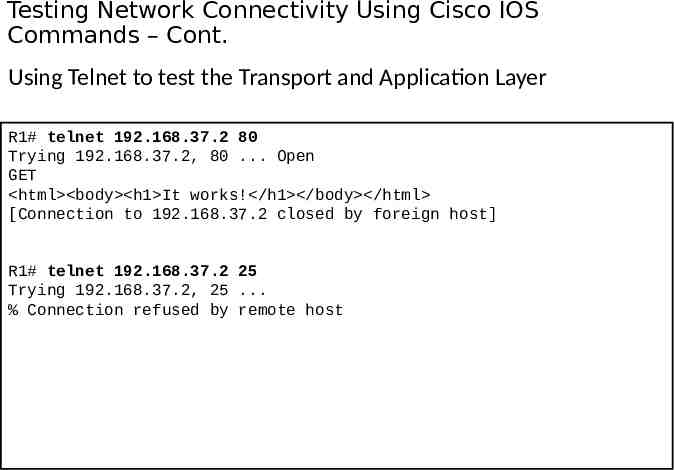
Testing Network Connectivity Using Cisco IOS Commands – Cont. Using Telnet to test the Transport and Application Layer R1# telnet 192.168.37.2 80 Trying 192.168.37.2, 80 . Open GET html body h1 It works! /h1 /body /html [Connection to 192.168.37.2 closed by foreign host] R1# telnet 192.168.37.2 25 Trying 192.168.37.2, 25 . % Connection refused by remote host
Collecting Real-time Information Using Cisco IOS debug Commands The debug ip packet command output R1# debug ip packet IP: s 172.69.13.44 (Fddi0), d 10.125.254.1 (Serial2), g 172.69.16.2, forward IP: s 172.69.1.57 (Ethernet4), d 10.36.125.2 (Serial2), g 172.69.16.2, forward IP: s 172.69.1.6 (Ethernet4), d 255.255.255.255, rcvd 2 IP: s 172.69.1.55 (Ethernet4), d 172.69.2.42 (Fddi0), g 172.69.13.6, forward IP: s 172.69.89.33 (Ethernet2), d 10.130.2.156 (Serial2), g 172.69.16.2, forward IP: s 172.69.1.27 (Ethernet4), d 172.69.43.126 (Fddi1), g 172.69.23.5, forward IP: s 172.69.1.27 (Ethernet4), d 172.69.43.126 (Fddi0), g 172.69.13.6, forward IP: s 172.69.20.32 (Ethernet2), d 255.255.255.255, rcvd 2 IP: s 172.69.1.57 (Ethernet4), d 10.36.125.2 (Serial2), g 172.69.16.2, access denied
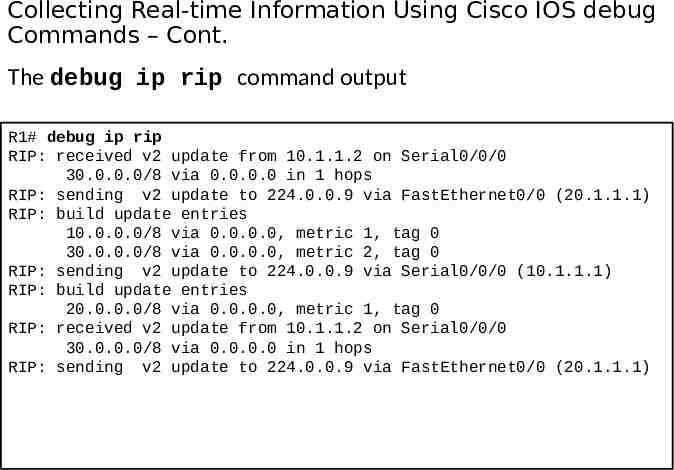
Collecting Real-time Information Using Cisco IOS debug Commands – Cont. The debug ip rip command output R1# debug ip rip RIP: received v2 update from 10.1.1.2 on Serial0/0/0 30.0.0.0/8 via 0.0.0.0 in 1 hops RIP: sending v2 update to 224.0.0.9 via FastEthernet0/0 (20.1.1.1) RIP: build update entries 10.0.0.0/8 via 0.0.0.0, metric 1, tag 0 30.0.0.0/8 via 0.0.0.0, metric 2, tag 0 RIP: sending v2 update to 224.0.0.9 via Serial0/0/0 (10.1.1.1) RIP: build update entries 20.0.0.0/8 via 0.0.0.0, metric 1, tag 0 RIP: received v2 update from 10.1.1.2 on Serial0/0/0 30.0.0.0/8 via 0.0.0.0 in 1 hops RIP: sending v2 update to 224.0.0.9 via FastEthernet0/0 (20.1.1.1)
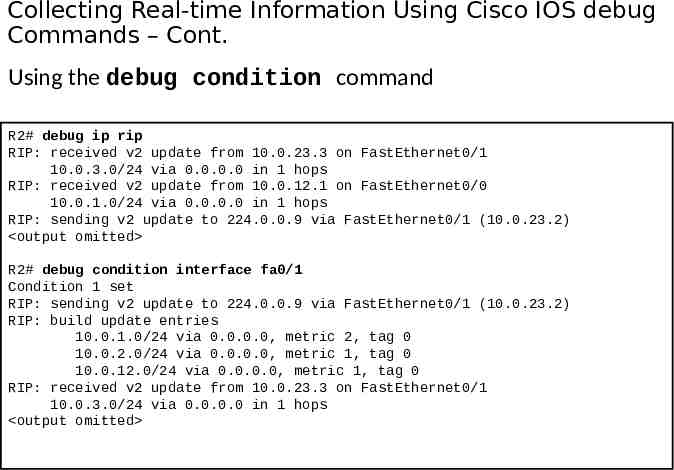
Collecting Real-time Information Using Cisco IOS debug Commands – Cont. Using the debug condition command R2# debug ip rip RIP: received v2 update from 10.0.23.3 on FastEthernet0/1 10.0.3.0/24 via 0.0.0.0 in 1 hops RIP: received v2 update from 10.0.12.1 on FastEthernet0/0 10.0.1.0/24 via 0.0.0.0 in 1 hops RIP: sending v2 update to 224.0.0.9 via FastEthernet0/1 (10.0.23.2) output omitted R2# debug condition interface fa0/1 Condition 1 set RIP: sending v2 update to 224.0.0.9 via FastEthernet0/1 (10.0.23.2) RIP: build update entries 10.0.1.0/24 via 0.0.0.0, metric 2, tag 0 10.0.2.0/24 via 0.0.0.0, metric 1, tag 0 10.0.12.0/24 via 0.0.0.0, metric 1, tag 0 RIP: received v2 update from 10.0.23.3 on FastEthernet0/1 10.0.3.0/24 via 0.0.0.0 in 1 hops output omitted
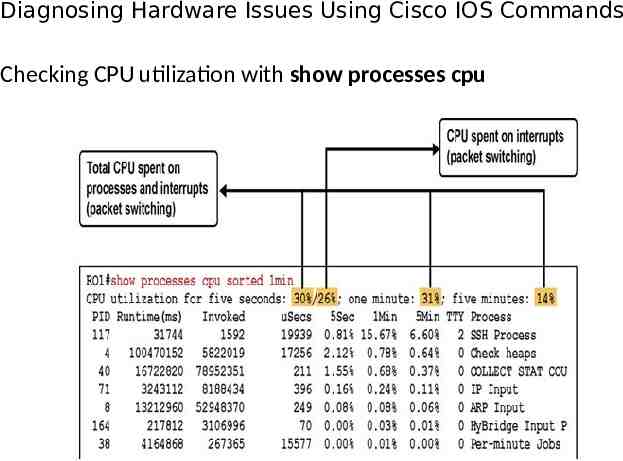
Diagnosing Hardware Issues Using Cisco IOS Commands Checking CPU utilization with show processes cpu
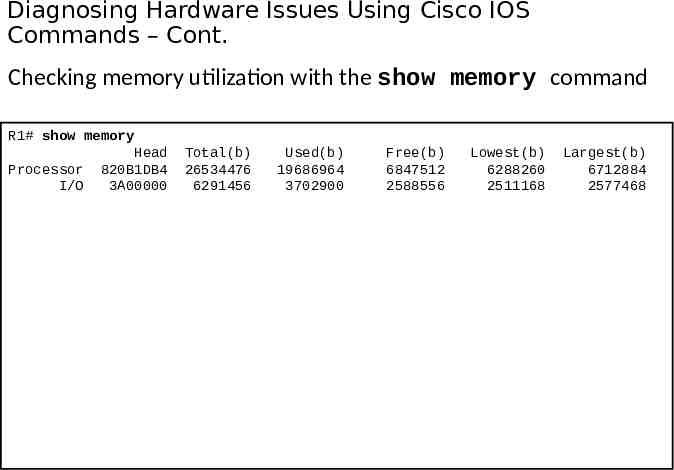
Diagnosing Hardware Issues Using Cisco IOS Commands – Cont. Checking memory utilization with the show memory command R1# show memory Head Processor 820B1DB4 I/O 3A00000 Total(b) 26534476 6291456 Used(b) 19686964 3702900 Free(b) 6847512 2588556 Lowest(b) 6288260 2511168 Largest(b) 6712884 2577468
Diagnosing Hardware Issues Using Cisco IOS Commands – Cont. Checking interfaces with the show interfaces command R1# show interfaces FastEthernet 0/0 FastEthernet0/0 is up, line protocol is up output omitted Last input 00:00:00, output 00:00:01, output hang never Last clearing of "show interface" counters never Input queue: 0/75/1120/0 (size/max/drops/flushes); Total output drops: 0 Queueing strategy: fifo Output queue: 0/40 (size/max) 5 minute input rate 2000 bits/sec, 3 packets/sec 5 minute output rate 0 bits/sec, 1 packets/sec 110834589 packets input, 1698341767 bytes Received 61734527 broadcasts, 0 runts, 0 giants, 565 throttles 30 input errors, 5 CRC, 1 frame, 0 overrun, 25 ignored 0 watchdog 0 input packets with dribble condition detected 35616938 packets output, 526385834 bytes, 0 underruns 0 output errors, 0 collisions, 1 interface resets 0 babbles, 0 late collision, 0 deferred 0 lost carrier, 0 no carrier 0 output buffer failures, 0 output buffers swapped out
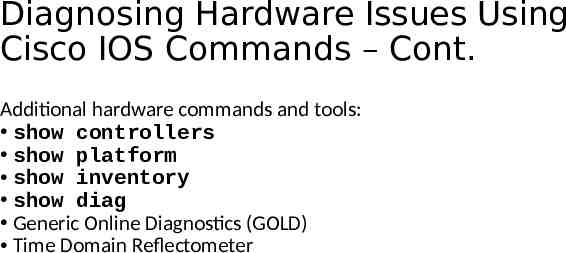
Diagnosing Hardware Issues Using Cisco IOS Commands – Cont. Additional hardware commands and tools: show controllers show platform show inventory show diag Generic Online Diagnostics (GOLD) Time Domain Reflectometer
Using Specialized Maintenance and Troubleshootin g Tools
Using Traffic Capturing Tools Sample screen shot from a protocol analyzer
Using Traffic Capturing Tools – Cont. Switched Port Analyzer (SPAN)
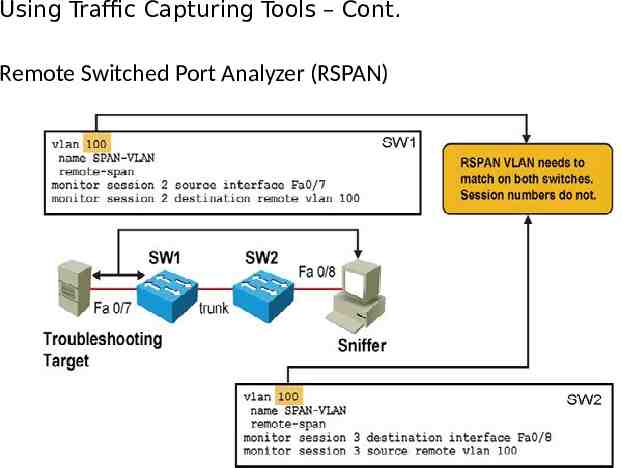
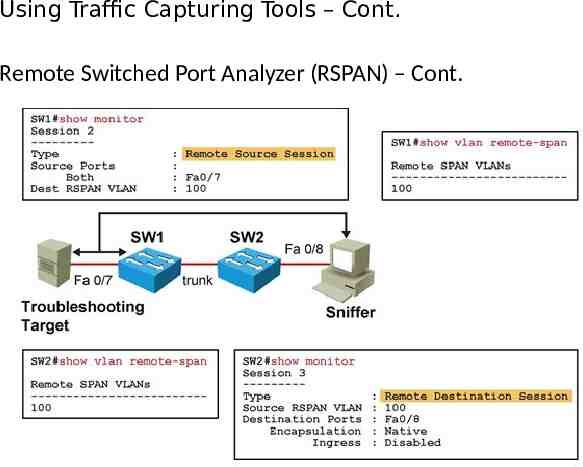
Using Traffic Capturing Tools – Cont. Remote Switched Port Analyzer (RSPAN)
Using Traffic Capturing Tools – Cont. Remote Switched Port Analyzer (RSPAN) – Cont.
Gathering Information with SNMP A Simple SNMP Configuration Example
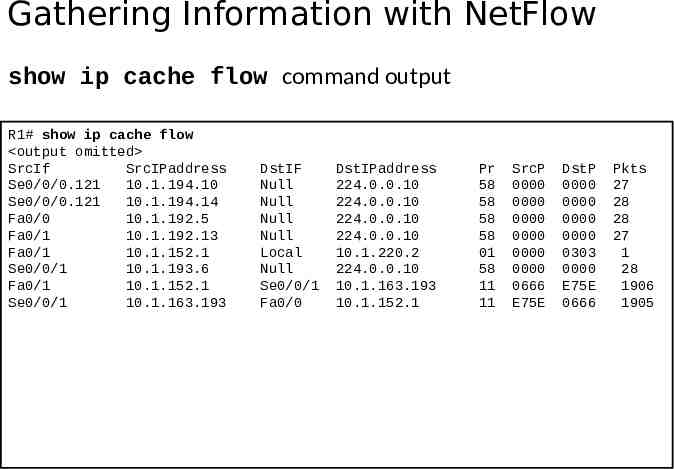
Gathering Information with NetFlow A Simple NetFlow Configuration Example
Gathering Information with NetFlow show ip cache flow command output R1# show ip cache flow output omitted SrcIf SrcIPaddress Se0/0/0.121 10.1.194.10 Se0/0/0.121 10.1.194.14 Fa0/0 10.1.192.5 Fa0/1 10.1.192.13 Fa0/1 10.1.152.1 Se0/0/1 10.1.193.6 Fa0/1 10.1.152.1 Se0/0/1 10.1.163.193 DstIF Null Null Null Null Local Null Se0/0/1 Fa0/0 DstIPaddress 224.0.0.10 224.0.0.10 224.0.0.10 224.0.0.10 10.1.220.2 224.0.0.10 10.1.163.193 10.1.152.1 Pr 58 58 58 58 01 58 11 11 SrcP 0000 0000 0000 0000 0000 0000 0666 E75E DstP 0000 0000 0000 0000 0303 0000 E75E 0666 Pkts 27 28 28 27 1 28 1906 1905
SNMP and NetFlow Comparison Both are used to gather statistics from Cisco switches and routers. SNMP’s focus is primarily on the collection of various statistics from components within network devices. A NetFlow enabled device collects information about the IP traffic flowing through the device. NetFlow uses a “push” based model – devices send data to a collector. SNMP is considered pull-based – the NMS queries SNMP Agents. NetFlow only gathers traffic statistics. SNMP can also collect many other performance indicators such as interface errors, CPU usage, and memory usage. Statistics collected using NetFlow have more granularity. NetFlow is currently supported on most Cisco IOS routers but only the 4500 and 6500 series switches
Enabling Network Event Notification A key element of a proactive network management strategy is fault notification. SNMP and syslog - two popular protocols that are used for the purpose of event notification. Embedded Event Manager (EEM) - Cisco IOS feature that provides an advanced method to create custom events and define actions to be taken in response to those events.
Enabling Network Event Notification – SNMP Enabling SNMP trap notification
Enabling Network Event Notification – Embedded Event Manager (EEM) Enables custom policies that trigger actions based on events: syslog messages Cisco IOS counter changes SNMP MIB object changes SNMP traps CLI command execution Timers and many other options Actions can consist of: Sending SNMP traps or syslog messages Executing CLI commands Sending email Running tool command language (TCL) scripts
Enabling Network Event Notification – EEM A sample EEM Configuration R1(config)# event manager applet CONFIG-STARTED R1(config-applet)# event cli pattern "configure terminal" sync no skip no occurs 1 R1(config-applet)# action 1.0 syslog priority critical msg "Configuration mode was entered" R1(config-applet)# action 2.0 syslog priority informational msg "Change control policies apply. Authorized access only."
Enabling Network Event Notification – EEM A sample EEM policy result R1# conf t Enter configuration commands, one per line. End with CNTL/Z. R1(config)# Jul 13 03:24:41.473 PDT: %HA EM-2-LOG: CONFIG-STARTED: Configuration mode was entered Jul 13 03:24:41.473 PDT: %HA EM-6-LOG: CONFIG-STARTED: Change control policies apply. Authorized access only For more information, visit http://cisco.com/go/instrumentation
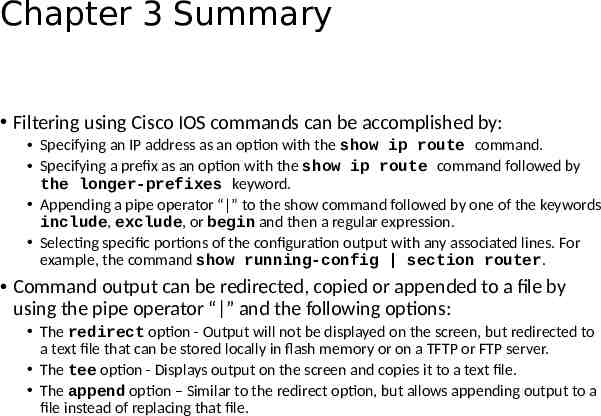
Chapter 3 Summary Filtering using Cisco IOS commands can be accomplished by: Specifying an IP address as an option with the show ip route command. Specifying a prefix as an option with the show ip route command followed by the longer-prefixes keyword. Appending a pipe operator “ ” to the show command followed by one of the keywords include, exclude, or begin and then a regular expression. Selecting specific portions of the configuration output with any associated lines. For example, the command show running-config section router. Command output can be redirected, copied or appended to a file by using the pipe operator “ ” and the following options: The redirect option - Output will not be displayed on the screen, but redirected to a text file that can be stored locally in flash memory or on a TFTP or FTP server. The tee option - Displays output on the screen and copies it to a text file. The append option – Similar to the redirect option, but allows appending output to a file instead of replacing that file.
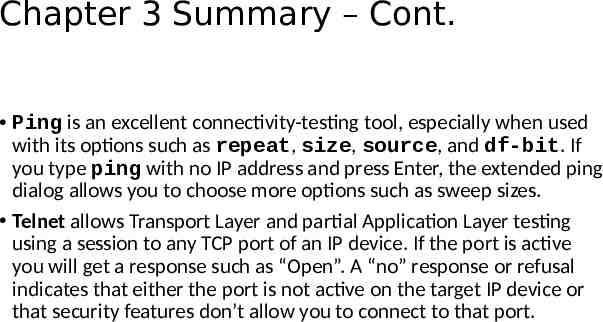
Chapter 3 Summary – Cont. Ping is an excellent connectivity-testing tool, especially when used with its options such as repeat, size, source, and df-bit. If you type ping with no IP address and press Enter, the extended ping dialog allows you to choose more options such as sweep sizes. Telnet allows Transport Layer and partial Application Layer testing using a session to any TCP port of an IP device. If the port is active you will get a response such as “Open”. A “no” response or refusal indicates that either the port is not active on the target IP device or that security features don’t allow you to connect to that port.
Chapter 3 Summary – Cont. Cisco IOS Software includes commands to diagnose hardware operation. Commands that are common to both routers and switches are: show processes cpu show memory show interfaces Other commands that can be useful in troubleshooting hardware related problems are: show show show show controllers platform inventory diag Some features that can be used to diagnose interface hardware or cabling issues are: Generic Online Diagnostics (GOLD) Time Domain Reflectometer (TDR)
Chapter 3 Summary – Cont. Examples of network monitoring and event reporting tools are: Logging system messages to syslog Event notification using SNMP Event notification using the Embedded Event Manager (EEM) Examples of incident related information gathering tools are SPAN and RSPAN (used for traffic capturing). Examples of baseline creation and traffic accounting tools are: Statistics gathering using SNMP Traffic accounting using NetFlow Packet sniffers can be used to capture packets in order to allow detailed analysis of packet flows. Taking packet captures at various points in the network allows you to spot potential differences. Two main technologies that can be used to create a baseline of network usage and performance are SNMP and NetFlow.
Chapter 3 Labs Lab 3-1 Assembling Maintenance and Troubleshooting Tools

