AfNOG 2010 Network Monitoring and Management Tutorial Introduction to
45 Slides4.65 MB
AfNOG 2010 Network Monitoring and Management Tutorial Introduction to Networking Monitoring and Management
Part I: Overview Core concepts presented: – What is network monitoring – What is network management – Getting started – Why network management – Attack detection – Consolidating the data – The big picture
What is network monitoring? Anyone have some ideas? Monitoring an active communications network in order to diagnose problems and gather statistics for administration and fine tuning. The term network monitoring describes the use of a system that constantly monitors a computer network for slow or failing components and that notifies the network administrator in case of outages via email, pager or other alarms. It is a subset of the functions involved in network management.
What is network management? Refers to the broad subject of managing computer networks. There exists a wide variety of software and hardware products that help network system administrators manage a network. Network management covers a wide area, including: - Security: Ensuring that the network is protected from unauthorized users. - Performance: Eliminating bottlenecks in the network. - Reliability: Making sure the network is available to users and responding to hardware and software malfunctions.
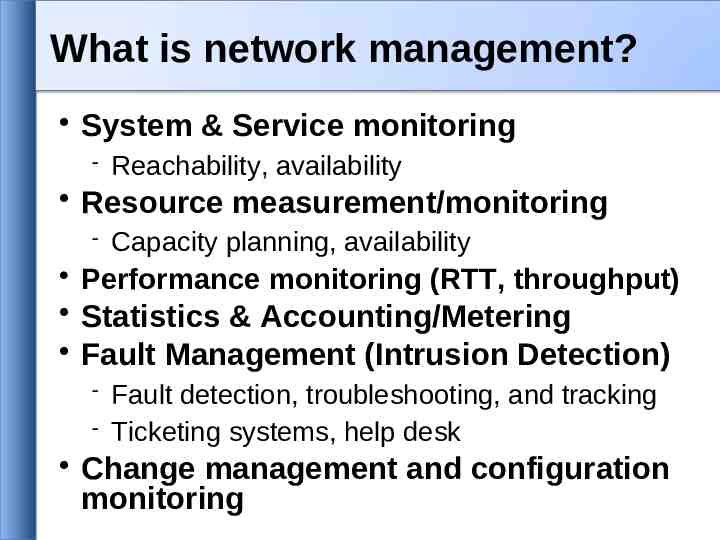
What is network management? System & Service monitoring Resource measurement/monitoring Reachability, availability Capacity planning, availability Performance monitoring (RTT, throughput) Statistics & Accounting/Metering Fault Management (Intrusion Detection) Fault detection, troubleshooting, and tracking Ticketing systems, help desk Change management and configuration monitoring
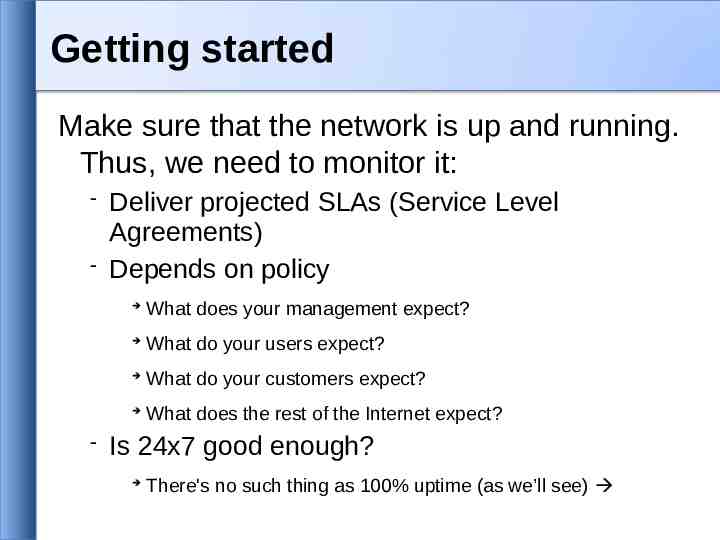
Getting started Make sure that the network is up and running. Thus, we need to monitor it: Deliver projected SLAs (Service Level Agreements) Depends on policy What does your management expect? What do your users expect? What do your customers expect? What does the rest of the Internet expect? Is 24x7 good enough? There's no such thing as 100% uptime (as we’ll see)
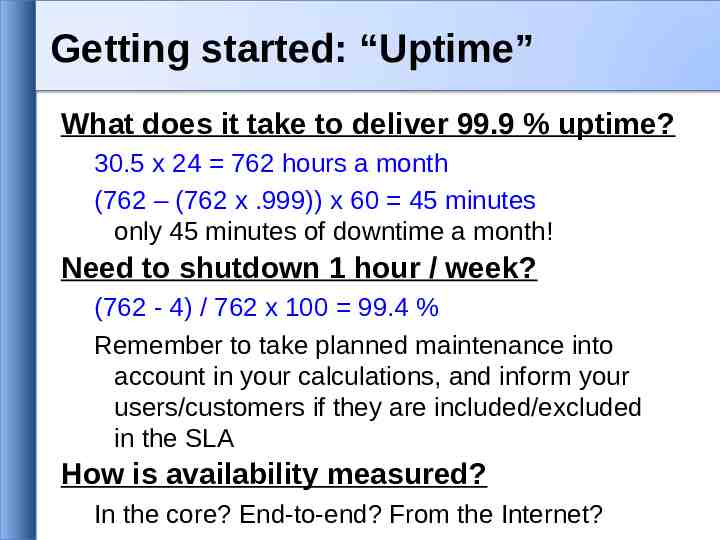
Getting started: “Uptime” What does it take to deliver 99.9 % uptime? 30.5 x 24 762 hours a month (762 – (762 x .999)) x 60 45 minutes only 45 minutes of downtime a month! Need to shutdown 1 hour / week? (762 - 4) / 762 x 100 99.4 % Remember to take planned maintenance into account in your calculations, and inform your users/customers if they are included/excluded in the SLA How is availability measured? In the core? End-to-end? From the Internet?
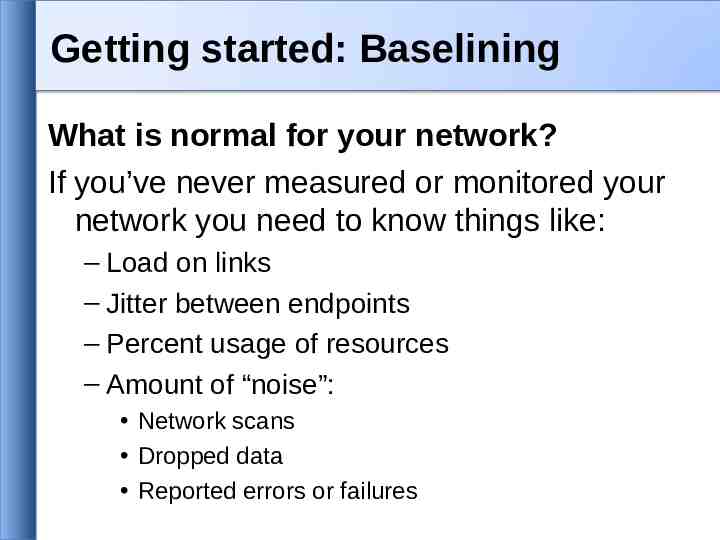
Getting started: Baselining What is normal for your network? If you’ve never measured or monitored your network you need to know things like: – Load on links – Jitter between endpoints – Percent usage of resources – Amount of “noise”: Network scans Dropped data Reported errors or failures
Why network management? Know when to upgrade Is your bandwidth usage too high? Where is your traffic going? Do you need to get a faster line, or more providers? Is the equipment too old? Keep an audit trace of changes Record all changes Makes it easier to find cause of problems due to upgrades and configuration changes Keep a history of your network operations – – Using a ticket system let you keep a history of events. Allows you to defend yourself and verify what happened
Why network management? Accounting – Track usage of resources – Bill customers according to usage Know when you have problems Stay ahead of your users! Makes you look good. Monitoring software can generate tickets and automatically notify staff of issues. Trends – All of this information can be used to view trends across your network. – This is part of baselining, capacity planning and attack detection.
Attack Detection Trends and automation allow you to know when you are under attack. The tools in use can help you to mitigate attacks: – – – Flows across network interfaces Load on specific servers and/or services Multiple service failures
Consolidating the data The Network Operations Center (NOC) “Where it all happens” Coordination of tasks Status of network and services Fielding of network-related incidents and complaints Where the tools reside (”NOC server”) Documentation including: Network diagrams database/flat file of each port on each switch Network description Much more as you'll see a bit later.
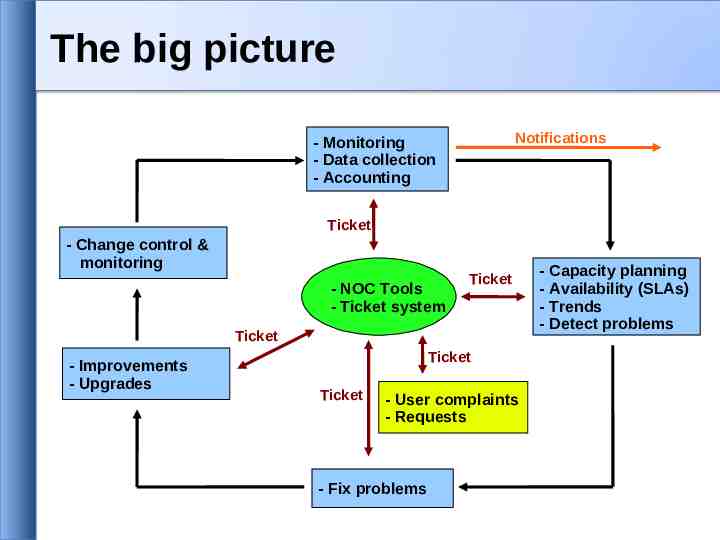
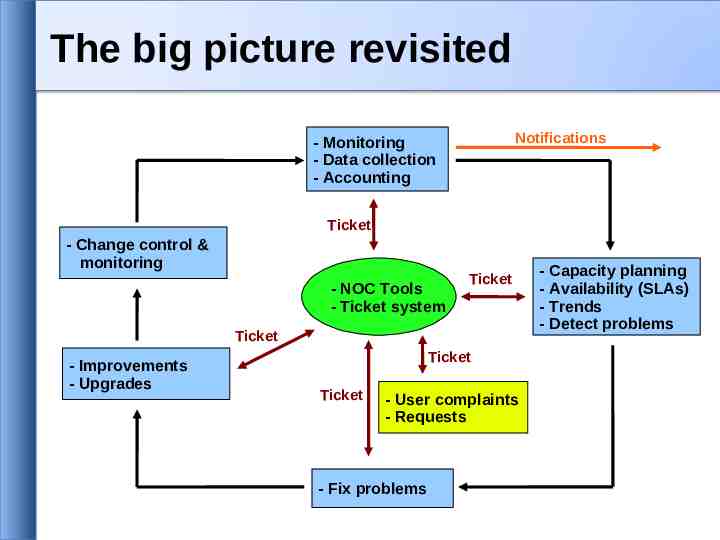
The big picture Notifications - Monitoring - Data collection - Accounting Ticket - Change control & monitoring - NOC Tools - Ticket system Ticket Ticket - Improvements - Upgrades Ticket Ticket - User complaints - Requests - Fix problems - Capacity planning - Availability (SLAs) - Trends - Detect problems
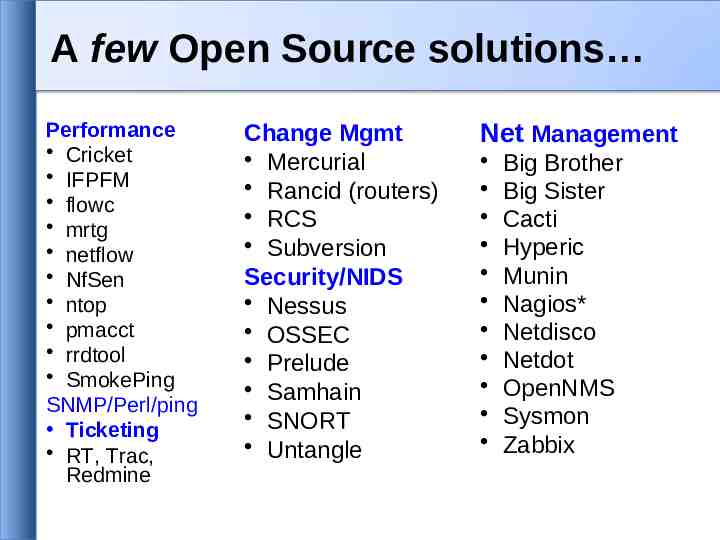
A few Open Source solutions Performance Cricket IFPFM flowc mrtg netflow NfSen ntop pmacct rrdtool SmokePing SNMP/Perl/ping Ticketing RT, Trac, Redmine Change Mgmt Mercurial Rancid (routers) RCS Subversion Security/NIDS Nessus OSSEC Prelude Samhain SNORT Untangle Net Management Big Brother Big Sister Cacti Hyperic Munin Nagios* Netdisco Netdot OpenNMS Sysmon Zabbix
Questions? ?
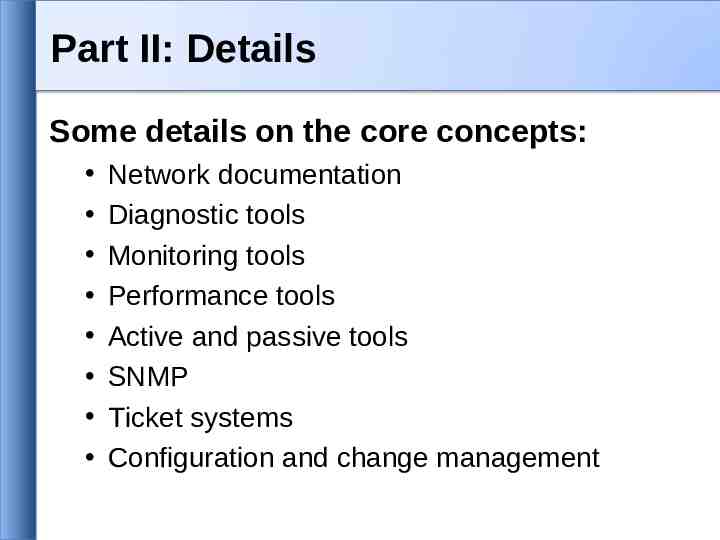
Part II: Details Some details on the core concepts: Network documentation Diagnostic tools Monitoring tools Performance tools Active and passive tools SNMP Ticket systems Configuration and change management
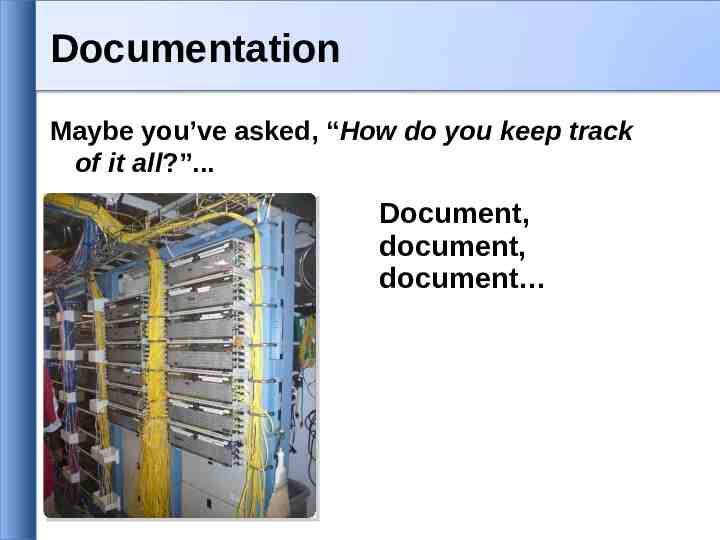
Documentation Maybe you’ve asked, “How do you keep track of it all?”. Document, document, document
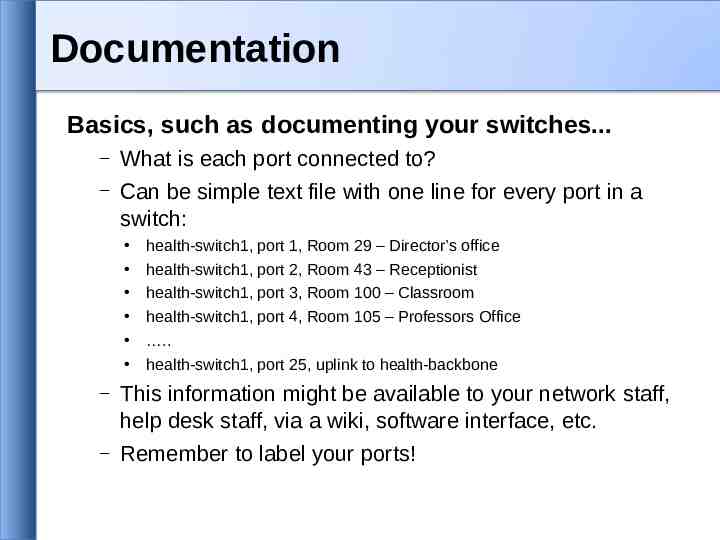
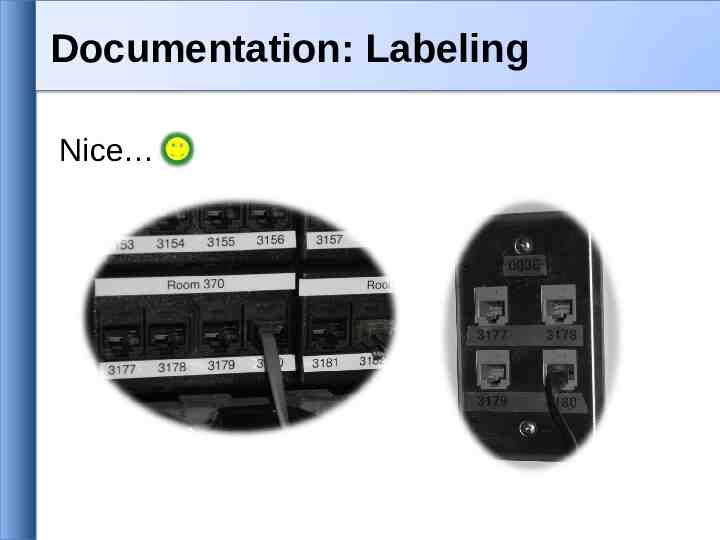
Documentation Basics, such as documenting your switches. – – What is each port connected to? Can be simple text file with one line for every port in a switch: – – health-switch1, port 1, Room 29 – Director’s office health-switch1, port 2, Room 43 – Receptionist health-switch1, port 3, Room 100 – Classroom health-switch1, port 4, Room 105 – Professors Office . health-switch1, port 25, uplink to health-backbone This information might be available to your network staff, help desk staff, via a wiki, software interface, etc. Remember to label your ports!
Documentation: Labeling Nice
Network Documentation More automation might be needed. An automated network documentation system is something to consider. – You can write local scripts to do this. – You can consider some automated documentation systems. – You’ll probably end up doing both.
Automated Systems There are quite a few automated network documentation systems. Each tends to do something different: – IPplan: http://iptrack.sourceforge.net/ – Netdisco: http://netdisco.org/ – Netdot: https://netdot.uoregon.edu/
IPplan: From the IPplan web page: “IPplan is a free (GPL), web based, multilingual, TCP IP address management (IPAM) software and tracking tool written in php 4, simplifying the administration of your IP address space. IPplan goes beyond TCPIP address management including DNS administration, configuration file management, circuit management (customizable via templates) and storing of hardware information (customizable via templates).” Lots of screenshots: http://iptrack.sourceforge.net/doku.php?id screenshots
Netdisco: Project launched 2003. Version 1.0 released October 2009. Some popular uses of Netdisco: – Locate a machine on the network by MAC or IP and show the switch port it lives at. – Turn Off a switch port while leaving an audit trail. Admins log why a port was shut down. – Inventory your network hardware by model, vendor, switch-card, firmware and operating system. – Report on IP address and switch port usage: historical and current. – Pretty pictures of your network.
Netdot: Includes functionality of IPplan and Netdisco and more. Core functionality includes: – Device discovery via SNMP – Layer2 topology discovery and graphs, using: CDP/LLDP Spanning Tree Protocol Switch forwarding tables Router point-to-point subnets – IPv4 and IPv6 address space management (IPAM) Address space visualization DNS/DHCP config management IP and MAC address tracking Continued
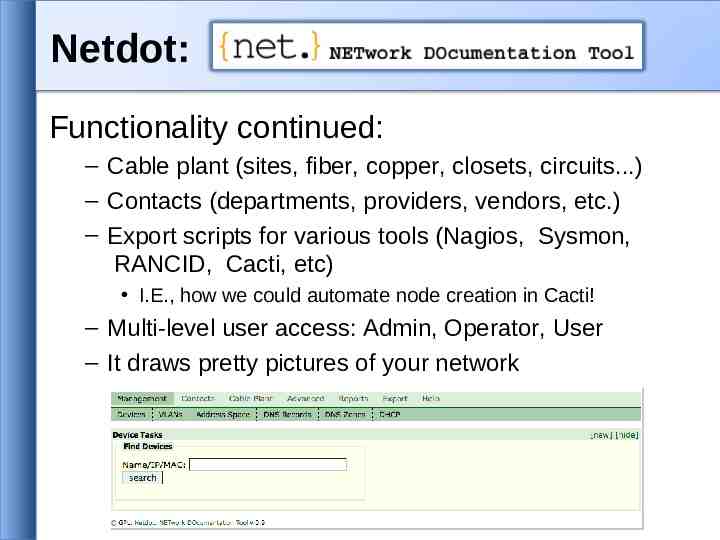
Netdot: Functionality continued: – Cable plant (sites, fiber, copper, closets, circuits.) – Contacts (departments, providers, vendors, etc.) – Export scripts for various tools (Nagios, Sysmon, RANCID, Cacti, etc) I.E., how we could automate node creation in Cacti! – Multi-level user access: Admin, Operator, User – It draws pretty pictures of your network
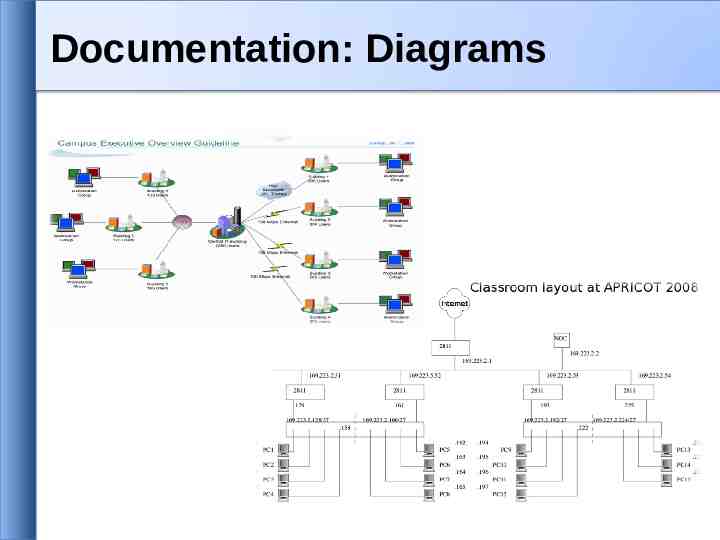
Documentation: Diagrams
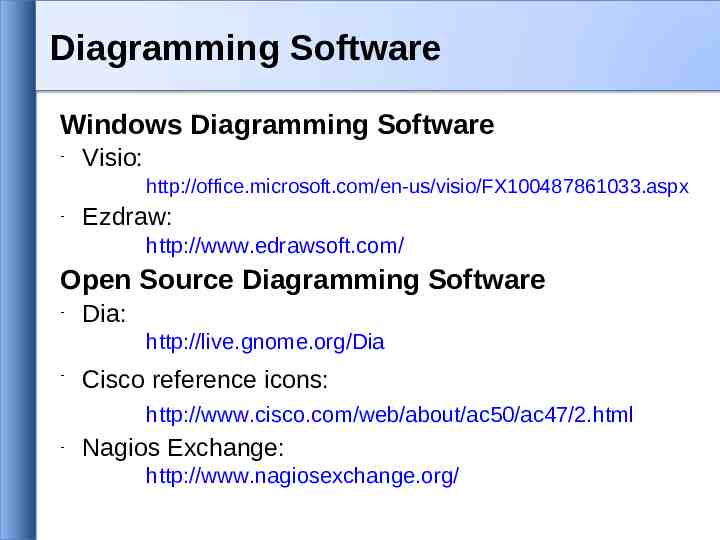
Diagramming Software Windows Diagramming Software - Visio: http://office.microsoft.com/en-us/visio/FX100487861033.aspx - Ezdraw: http://www.edrawsoft.com/ Open Source Diagramming Software - Dia: http://live.gnome.org/Dia - Cisco reference icons: http://www.cisco.com/web/about/ac50/ac47/2.html - Nagios Exchange: http://www.nagiosexchange.org/
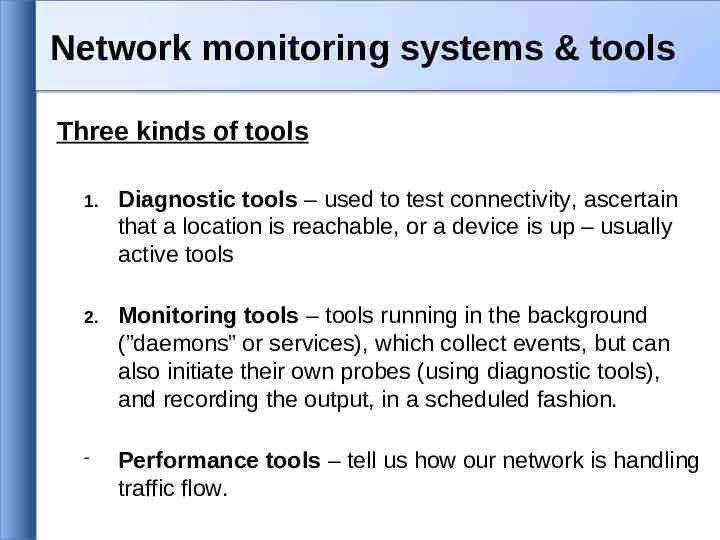
Network monitoring systems & tools Three kinds of tools 1. Diagnostic tools – used to test connectivity, ascertain that a location is reachable, or a device is up – usually active tools 2. Monitoring tools – tools running in the background (”daemons” or services), which collect events, but can also initiate their own probes (using diagnostic tools), and recording the output, in a scheduled fashion. Performance tools – tell us how our network is handling traffic flow.
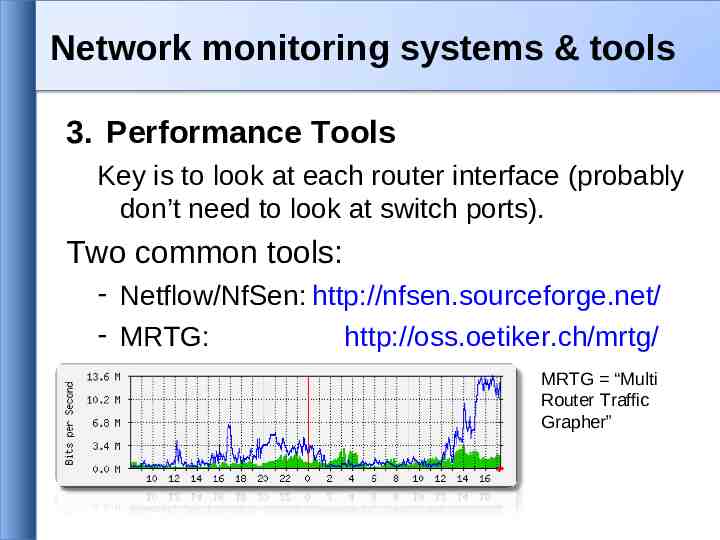
Network monitoring systems & tools 3. Performance Tools Key is to look at each router interface (probably don’t need to look at switch ports). Two common tools: - Netflow/NfSen: http://nfsen.sourceforge.net/ - MRTG: http://oss.oetiker.ch/mrtg/ MRTG “Multi Router Traffic Grapher”
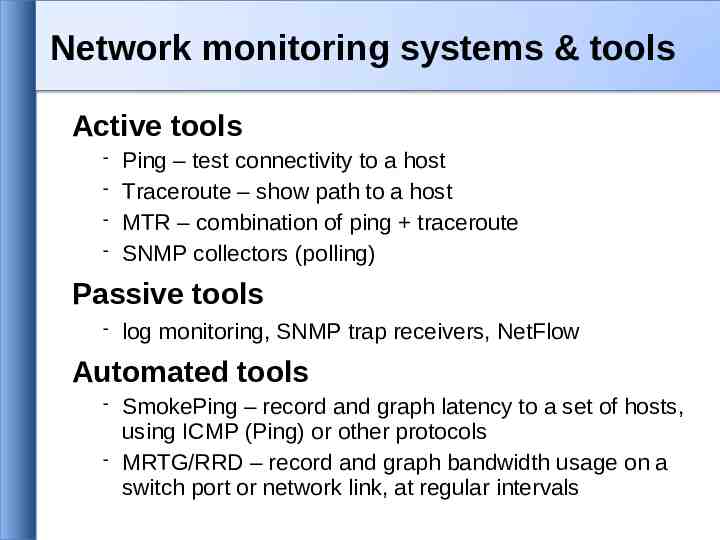
Network monitoring systems & tools Active tools Ping – test connectivity to a host Traceroute – show path to a host MTR – combination of ping traceroute SNMP collectors (polling) Passive tools log monitoring, SNMP trap receivers, NetFlow Automated tools SmokePing – record and graph latency to a set of hosts, using ICMP (Ping) or other protocols MRTG/RRD – record and graph bandwidth usage on a switch port or network link, at regular intervals
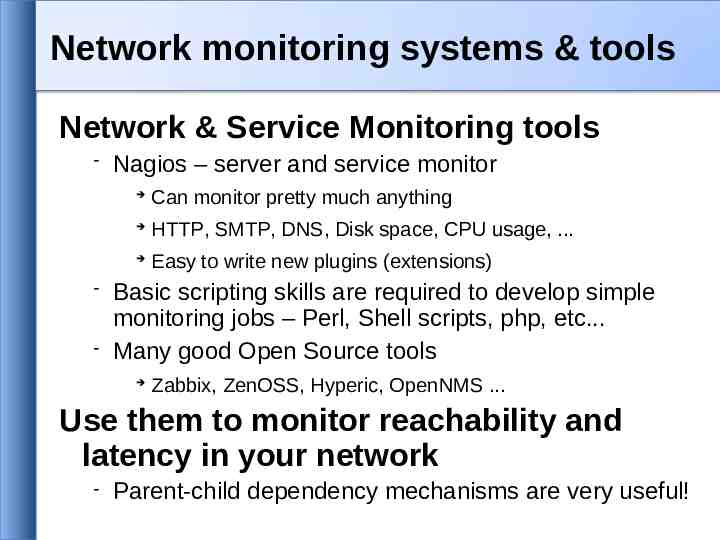
Network monitoring systems & tools Network & Service Monitoring tools Nagios – server and service monitor Can monitor pretty much anything HTTP, SMTP, DNS, Disk space, CPU usage, . Easy to write new plugins (extensions) Basic scripting skills are required to develop simple monitoring jobs – Perl, Shell scripts, php, etc. Many good Open Source tools Zabbix, ZenOSS, Hyperic, OpenNMS . Use them to monitor reachability and latency in your network Parent-child dependency mechanisms are very useful!
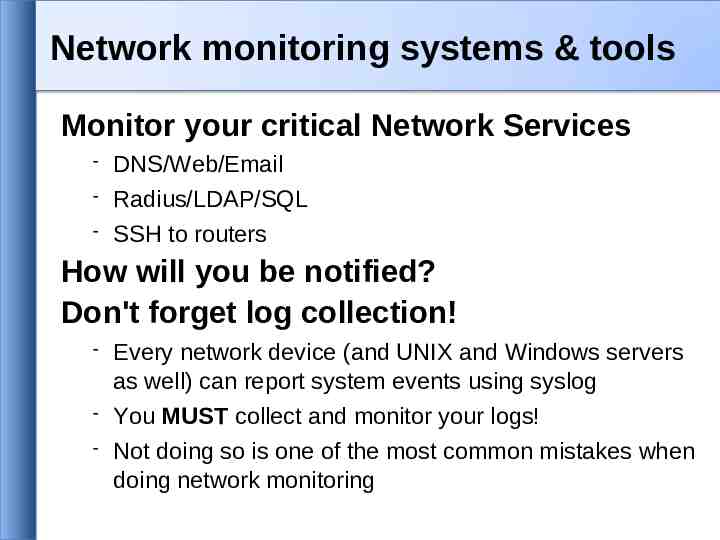
Network monitoring systems & tools Monitor your critical Network Services DNS/Web/Email Radius/LDAP/SQL SSH to routers How will you be notified? Don't forget log collection! Every network device (and UNIX and Windows servers as well) can report system events using syslog You MUST collect and monitor your logs! Not doing so is one of the most common mistakes when doing network monitoring
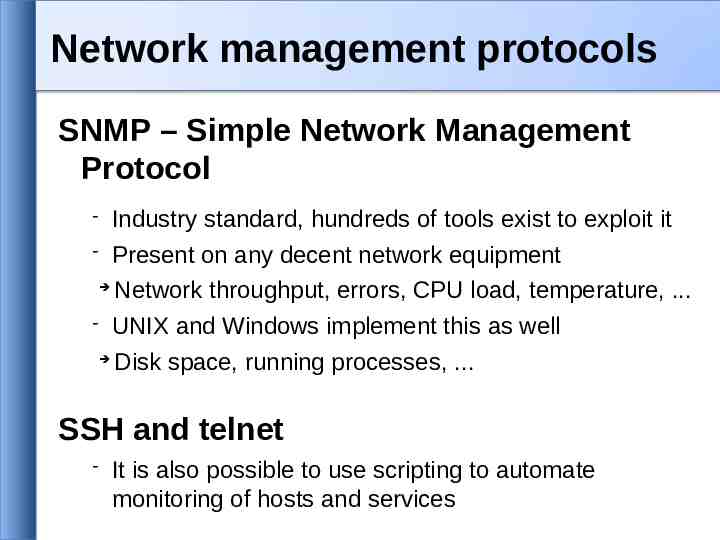
Network management protocols SNMP – Simple Network Management Protocol Industry standard, hundreds of tools exist to exploit it Present on any decent network equipment Network throughput, errors, CPU load, temperature, . UNIX and Windows implement this as well Disk space, running processes, . SSH and telnet It is also possible to use scripting to automate monitoring of hosts and services
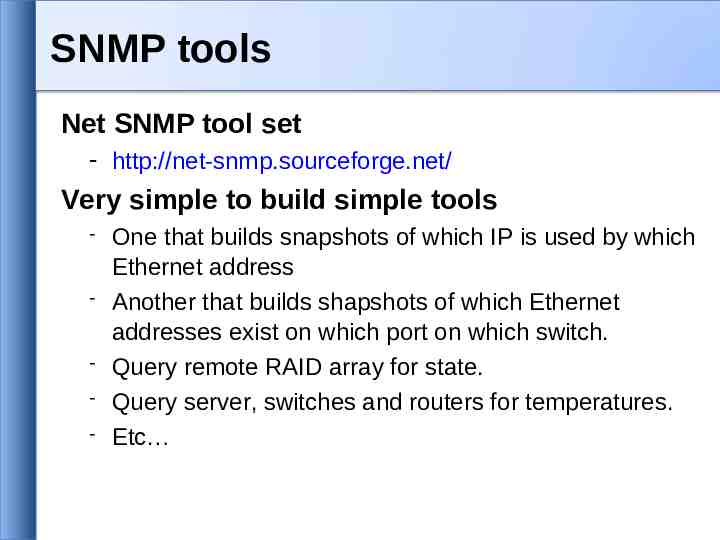
SNMP tools Net SNMP tool set - http://net-snmp.sourceforge.net/ Very simple to build simple tools One that builds snapshots of which IP is used by which Ethernet address Another that builds shapshots of which Ethernet addresses exist on which port on which switch. Query remote RAID array for state. Query server, switches and routers for temperatures. Etc
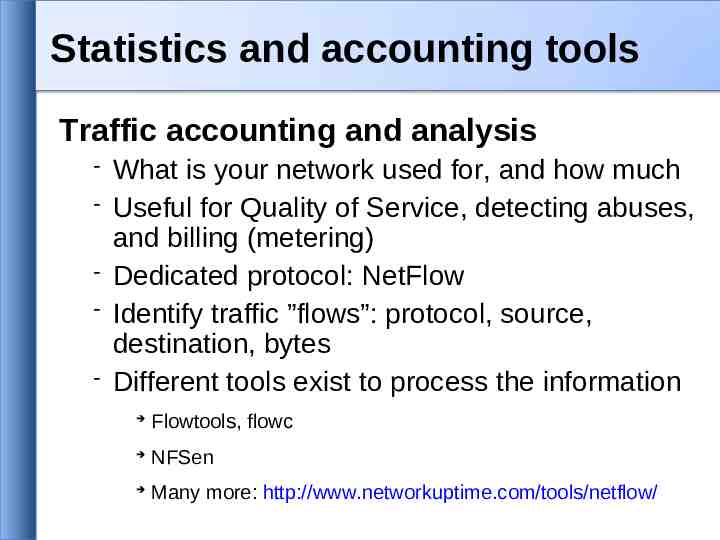
Statistics and accounting tools Traffic accounting and analysis What is your network used for, and how much Useful for Quality of Service, detecting abuses, and billing (metering) Dedicated protocol: NetFlow Identify traffic ”flows”: protocol, source, destination, bytes Different tools exist to process the information Flowtools, flowc NFSen Many more: http://www.networkuptime.com/tools/netflow/
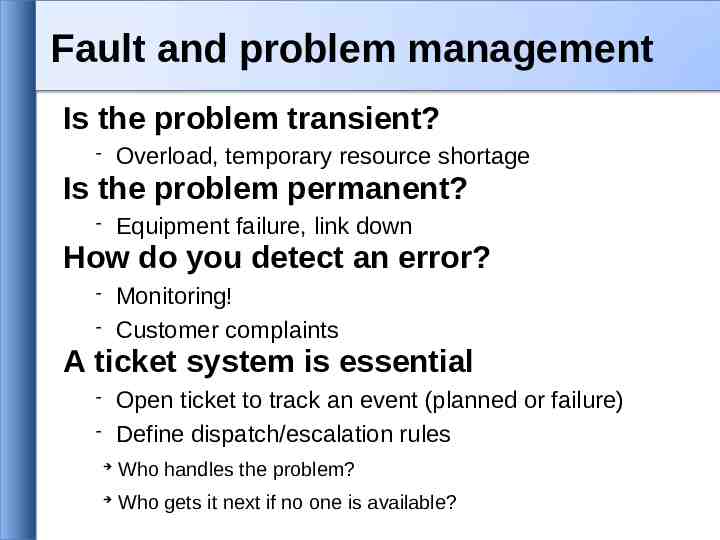
Fault and problem management Is the problem transient? Overload, temporary resource shortage Is the problem permanent? Equipment failure, link down How do you detect an error? Monitoring! Customer complaints A ticket system is essential Open ticket to track an event (planned or failure) Define dispatch/escalation rules Who handles the problem? Who gets it next if no one is available?
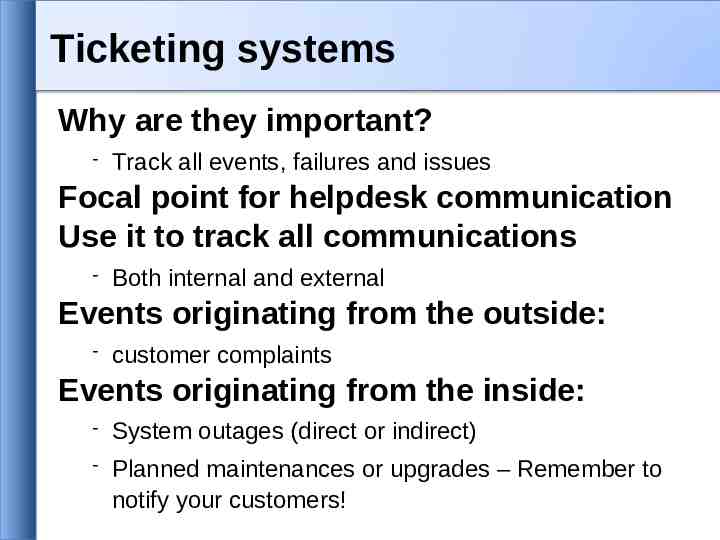
Ticketing systems Why are they important? Track all events, failures and issues Focal point for helpdesk communication Use it to track all communications Both internal and external Events originating from the outside: customer complaints Events originating from the inside: System outages (direct or indirect) Planned maintenances or upgrades – Remember to notify your customers!
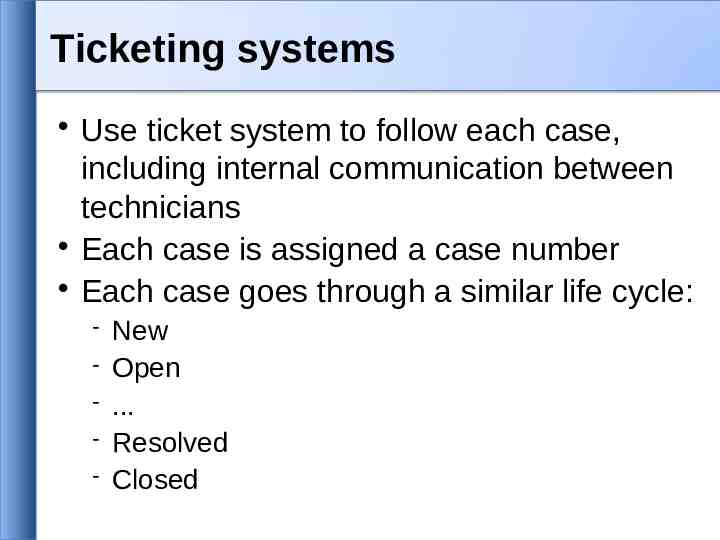
Ticketing systems Use ticket system to follow each case, including internal communication between technicians Each case is assigned a case number Each case goes through a similar life cycle: New Open . Resolved Closed
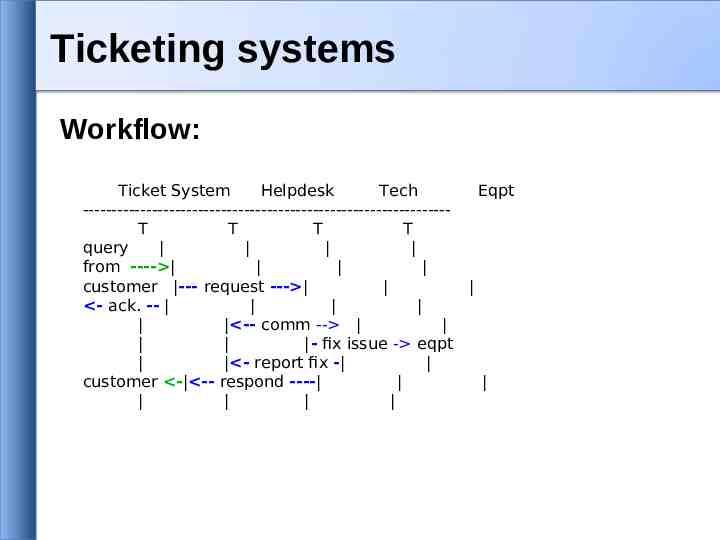
Ticketing systems Workflow: Ticket System Helpdesk Tech ---------------------------------------------------------------T T T T query from ---- customer --- request --- - ack. -- -- comm -- - fix issue - eqpt - report fix - customer - -- respond ---- Eqpt
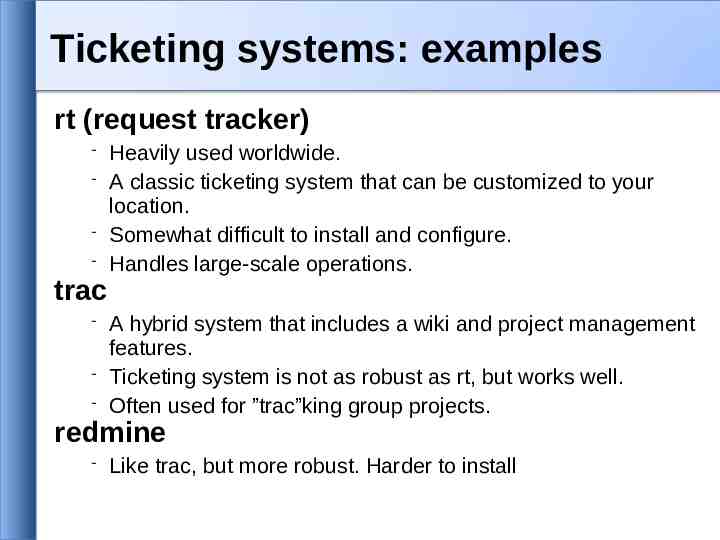
Ticketing systems: examples rt (request tracker) trac Heavily used worldwide. A classic ticketing system that can be customized to your location. Somewhat difficult to install and configure. Handles large-scale operations. A hybrid system that includes a wiki and project management features. Ticketing system is not as robust as rt, but works well. Often used for ”trac”king group projects. redmine Like trac, but more robust. Harder to install
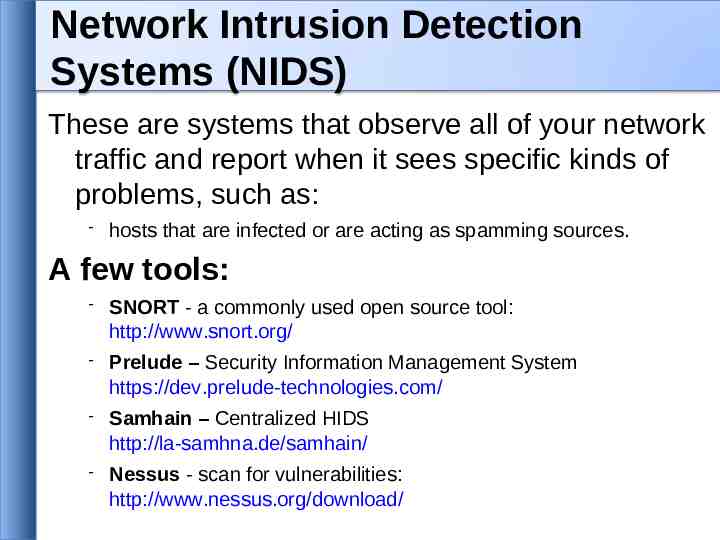
Network Intrusion Detection Systems (NIDS) These are systems that observe all of your network traffic and report when it sees specific kinds of problems, such as: hosts that are infected or are acting as spamming sources. A few tools: SNORT - a commonly used open source tool: http://www.snort.org/ Prelude – Security Information Management System https://dev.prelude-technologies.com/ Samhain – Centralized HIDS http://la-samhna.de/samhain/ Nessus - scan for vulnerabilities: http://www.nessus.org/download/
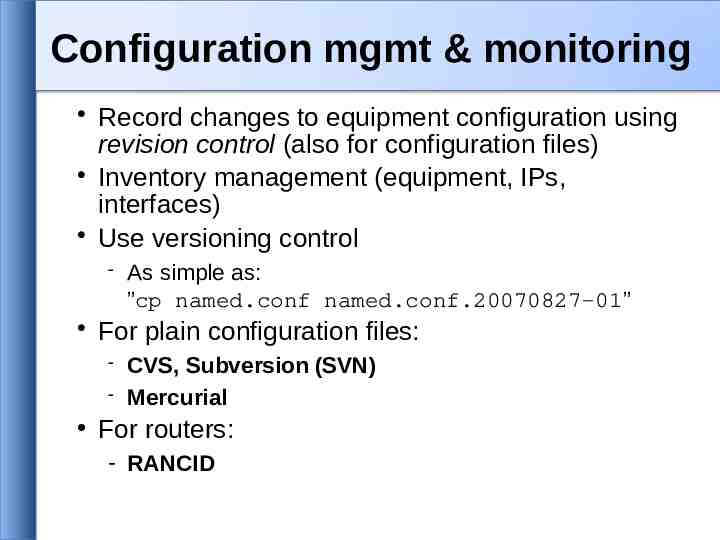
Configuration mgmt & monitoring Record changes to equipment configuration using revision control (also for configuration files) Inventory management (equipment, IPs, interfaces) Use versioning control As simple as: ”cp named.conf named.conf.20070827-01” For plain configuration files: CVS, Subversion (SVN) Mercurial For routers: - RANCID
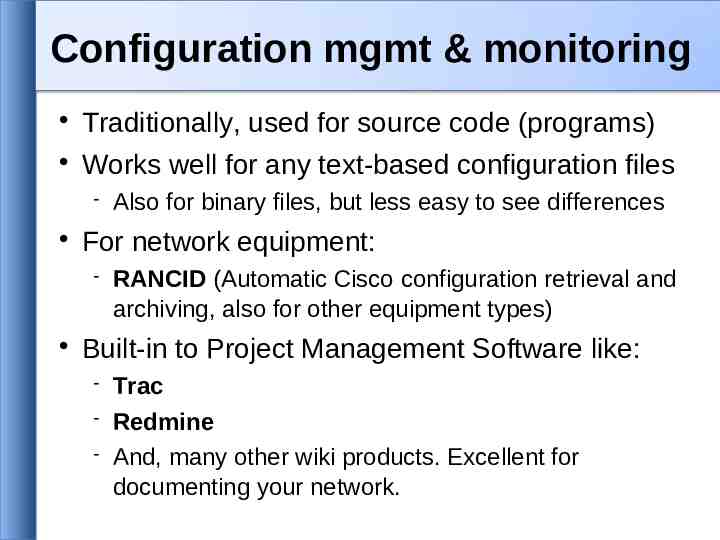
Configuration mgmt & monitoring Traditionally, used for source code (programs) Works well for any text-based configuration files For network equipment: Also for binary files, but less easy to see differences RANCID (Automatic Cisco configuration retrieval and archiving, also for other equipment types) Built-in to Project Management Software like: Trac Redmine And, many other wiki products. Excellent for documenting your network.
The big picture revisited Notifications - Monitoring - Data collection - Accounting Ticket - Change control & monitoring - NOC Tools - Ticket system Ticket Ticket - Improvements - Upgrades Ticket Ticket - User complaints - Requests - Fix problems - Capacity planning - Availability (SLAs) - Trends - Detect problems
Questions ?
